 Platwright
#4 · Template · v1.0
Rental Portfolio Dashboard — Excel & Google Sheets Template for Up to 10 Properties
Each property has its own file, its own loan and its own folder. Ask what the portfolio earns in a month and the answer takes an afternoon of adding — and the number you most want to know, how much of that rent depends on a single tenant, never gets calculated at all.
One-time purchase $34
Works in Excel and Google Sheets. One payment, yours to keep.
Checkout is handled by Payhip, our payment processor, so you will leave platwright.com to pay. The file and the Welcome Guide arrive by email the moment the payment clears. If anything goes wrong with the download, email platwrightdr@gmail.com and I will sort it.
What the file does
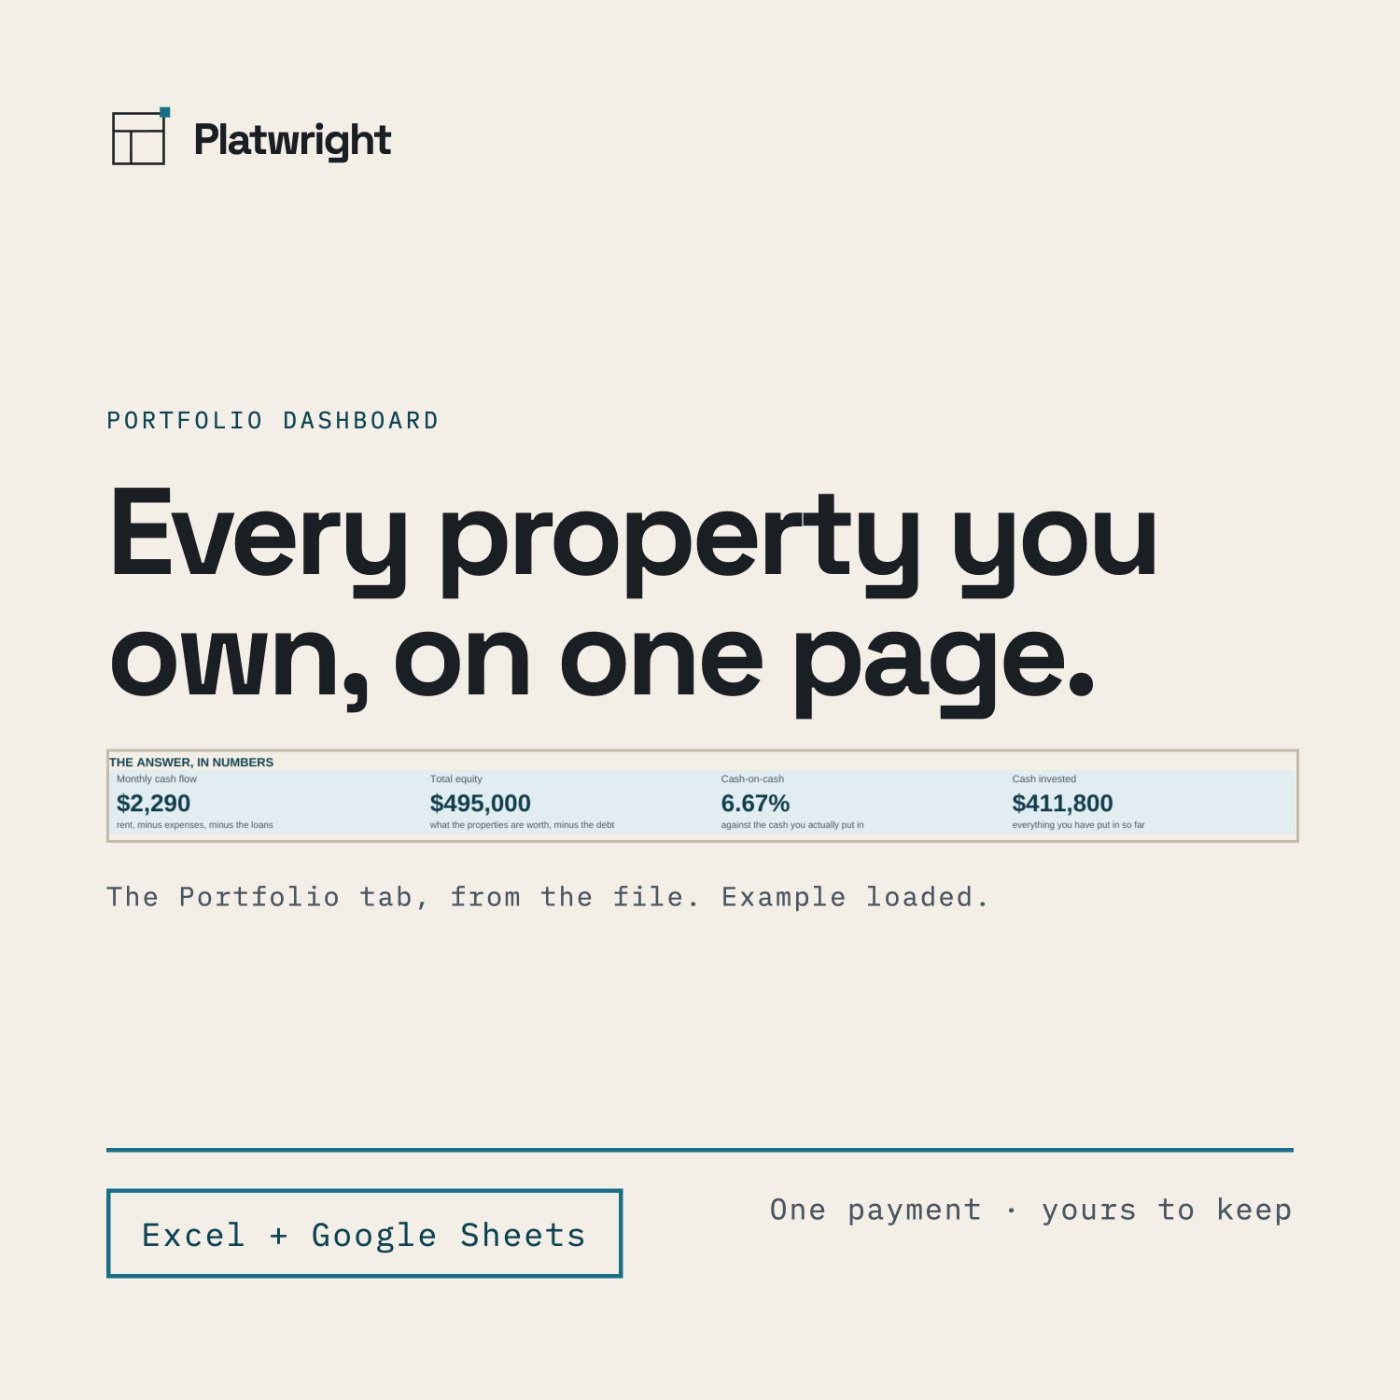
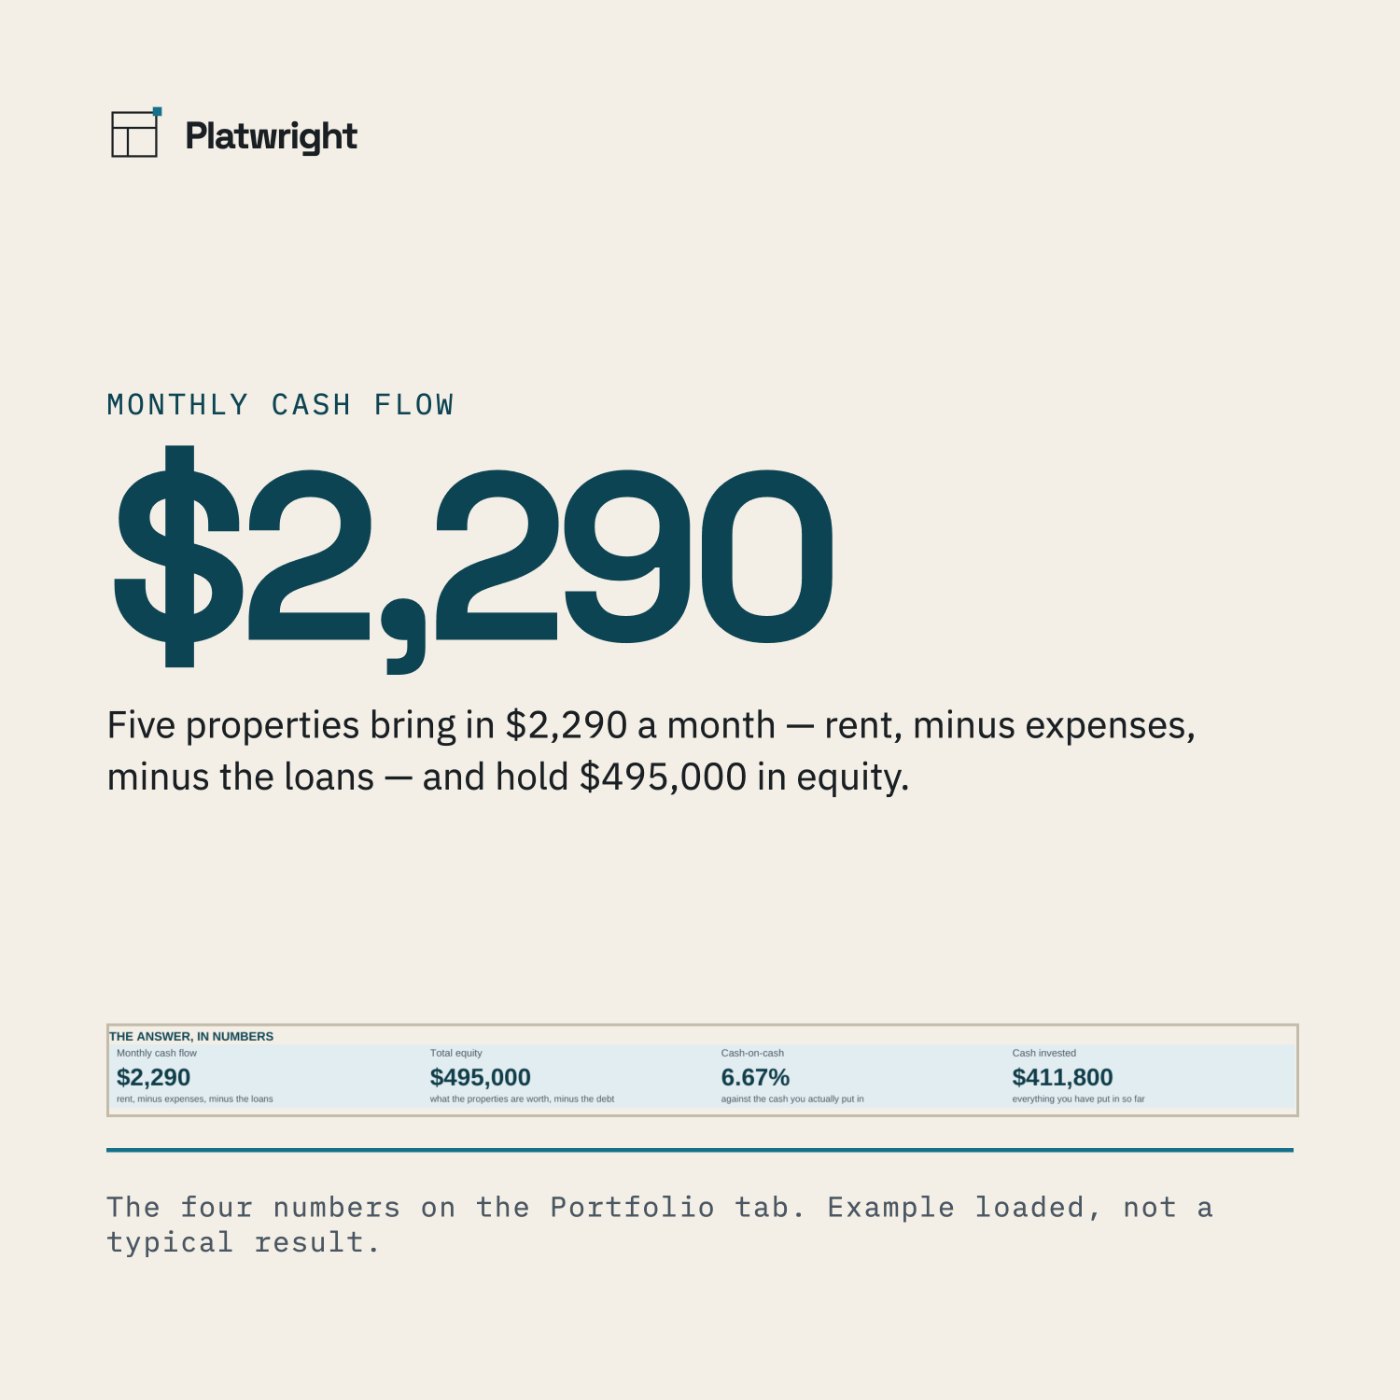
Portfolio Dashboard is one row per property and one page for the lot. You type eight numbers for each one — what you paid, what it is worth today, rent, expenses, debt, payment, cash invested — and the file adds them up: cash flow, equity, cash-on-cash, LTV and cap rate (market) for the whole portfolio, every property ranked by cash flow, and what happens to the total if any one of them goes vacant.
The number
What's included
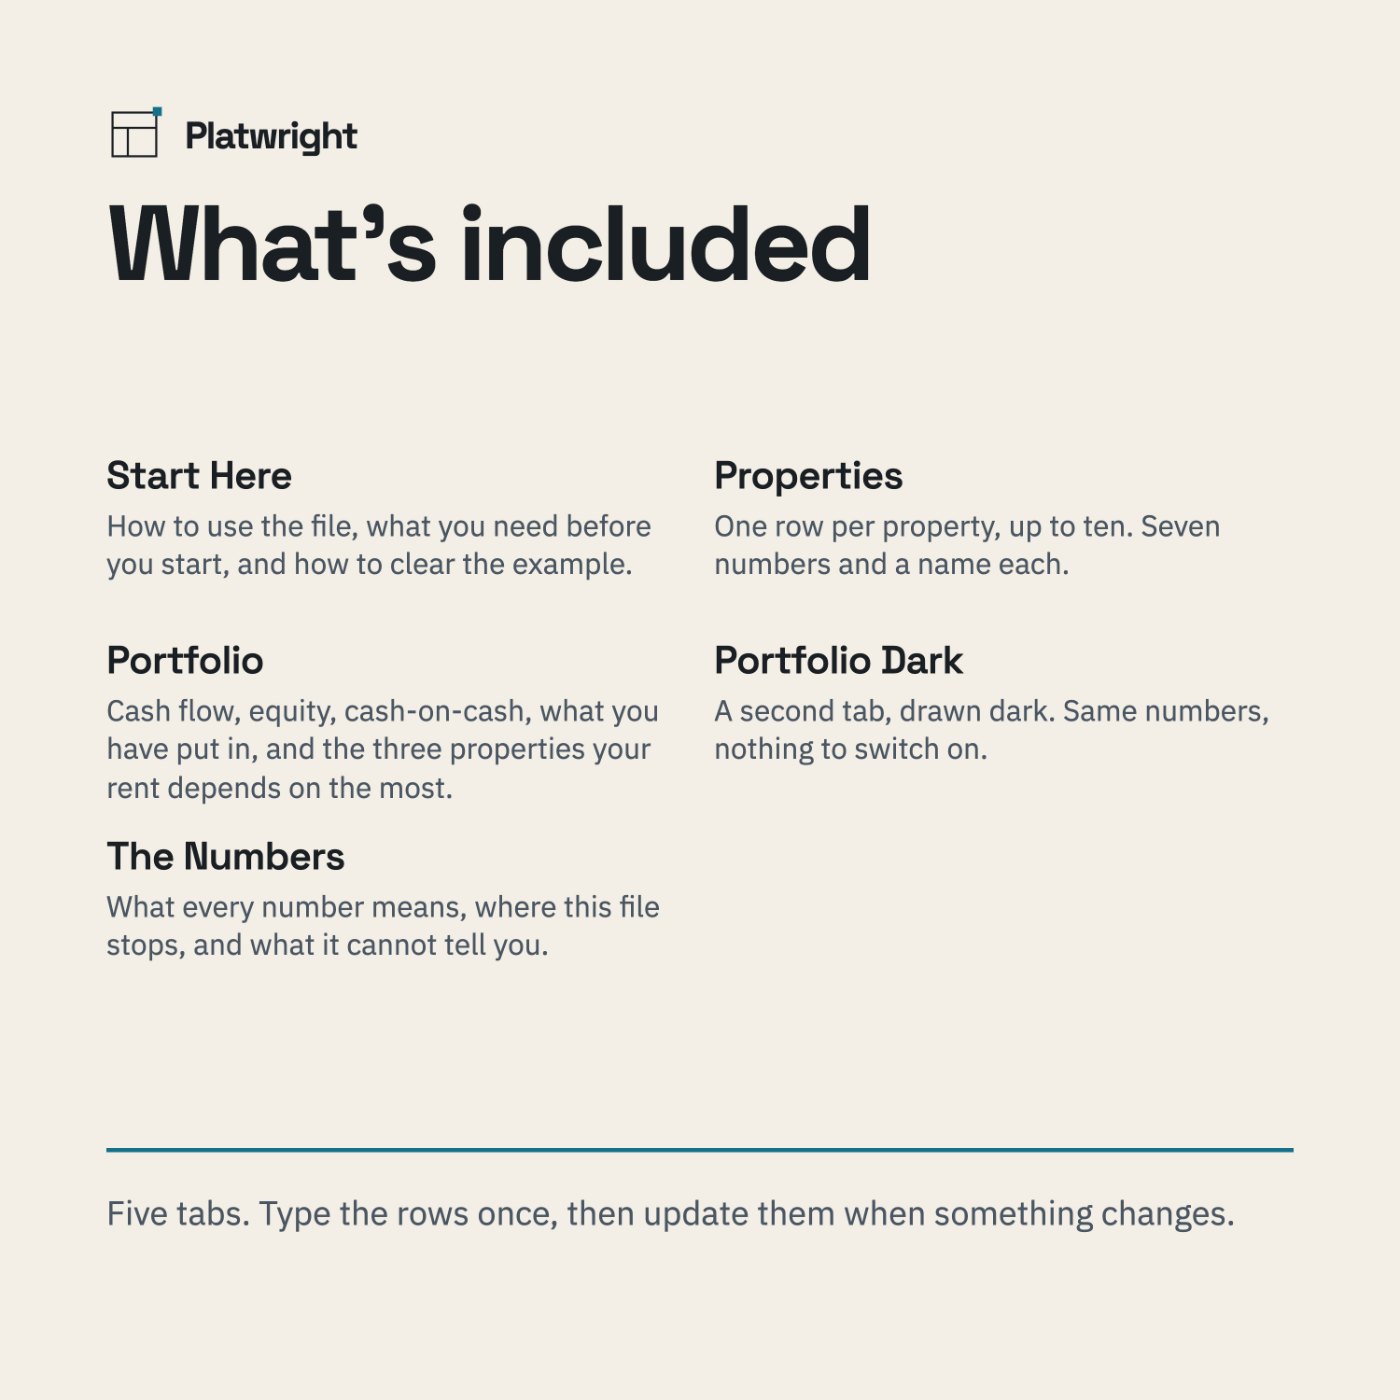
- Five tabs: Start Here · Properties · Portfolio · Portfolio Dark · The Numbers
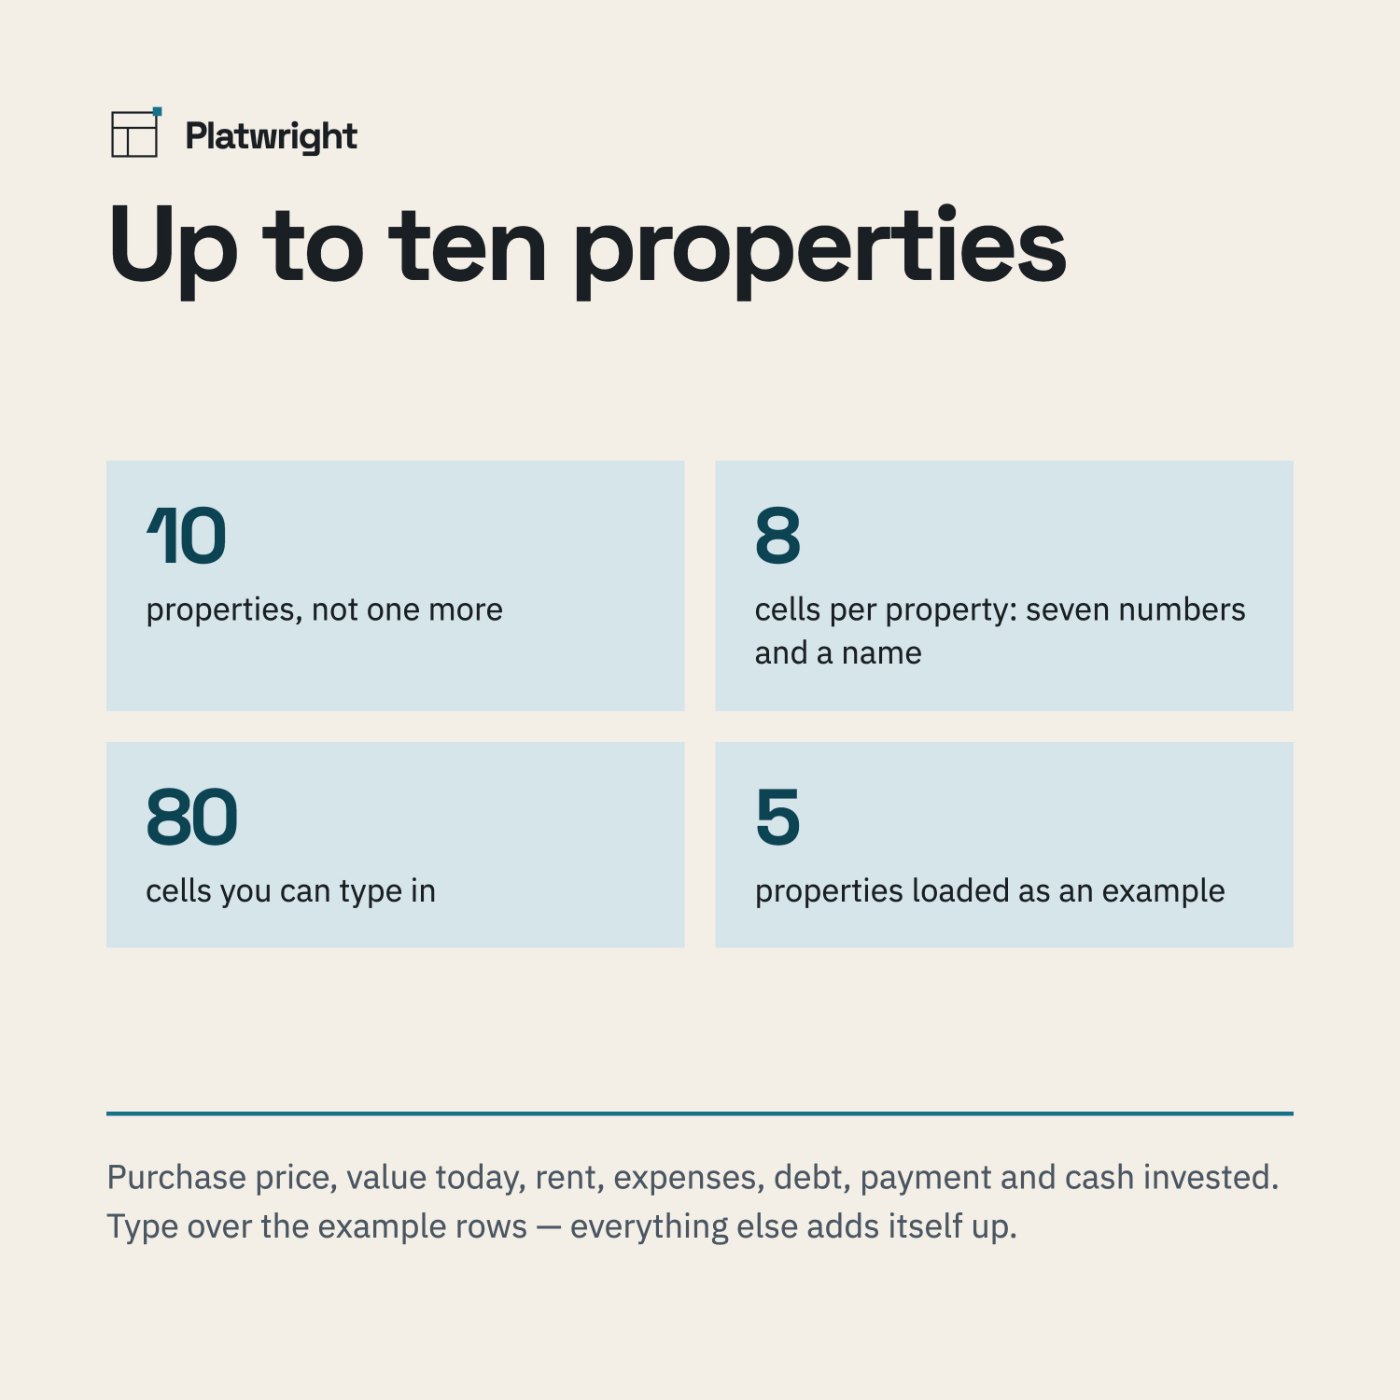
- Up to 10 properties, one row each — not one more
- 80 cells you can type in — ten rows × eight columns
- A worked example already loaded — five properties, from a $168,000 single to a $410,000 triplex — so nothing is ever blank
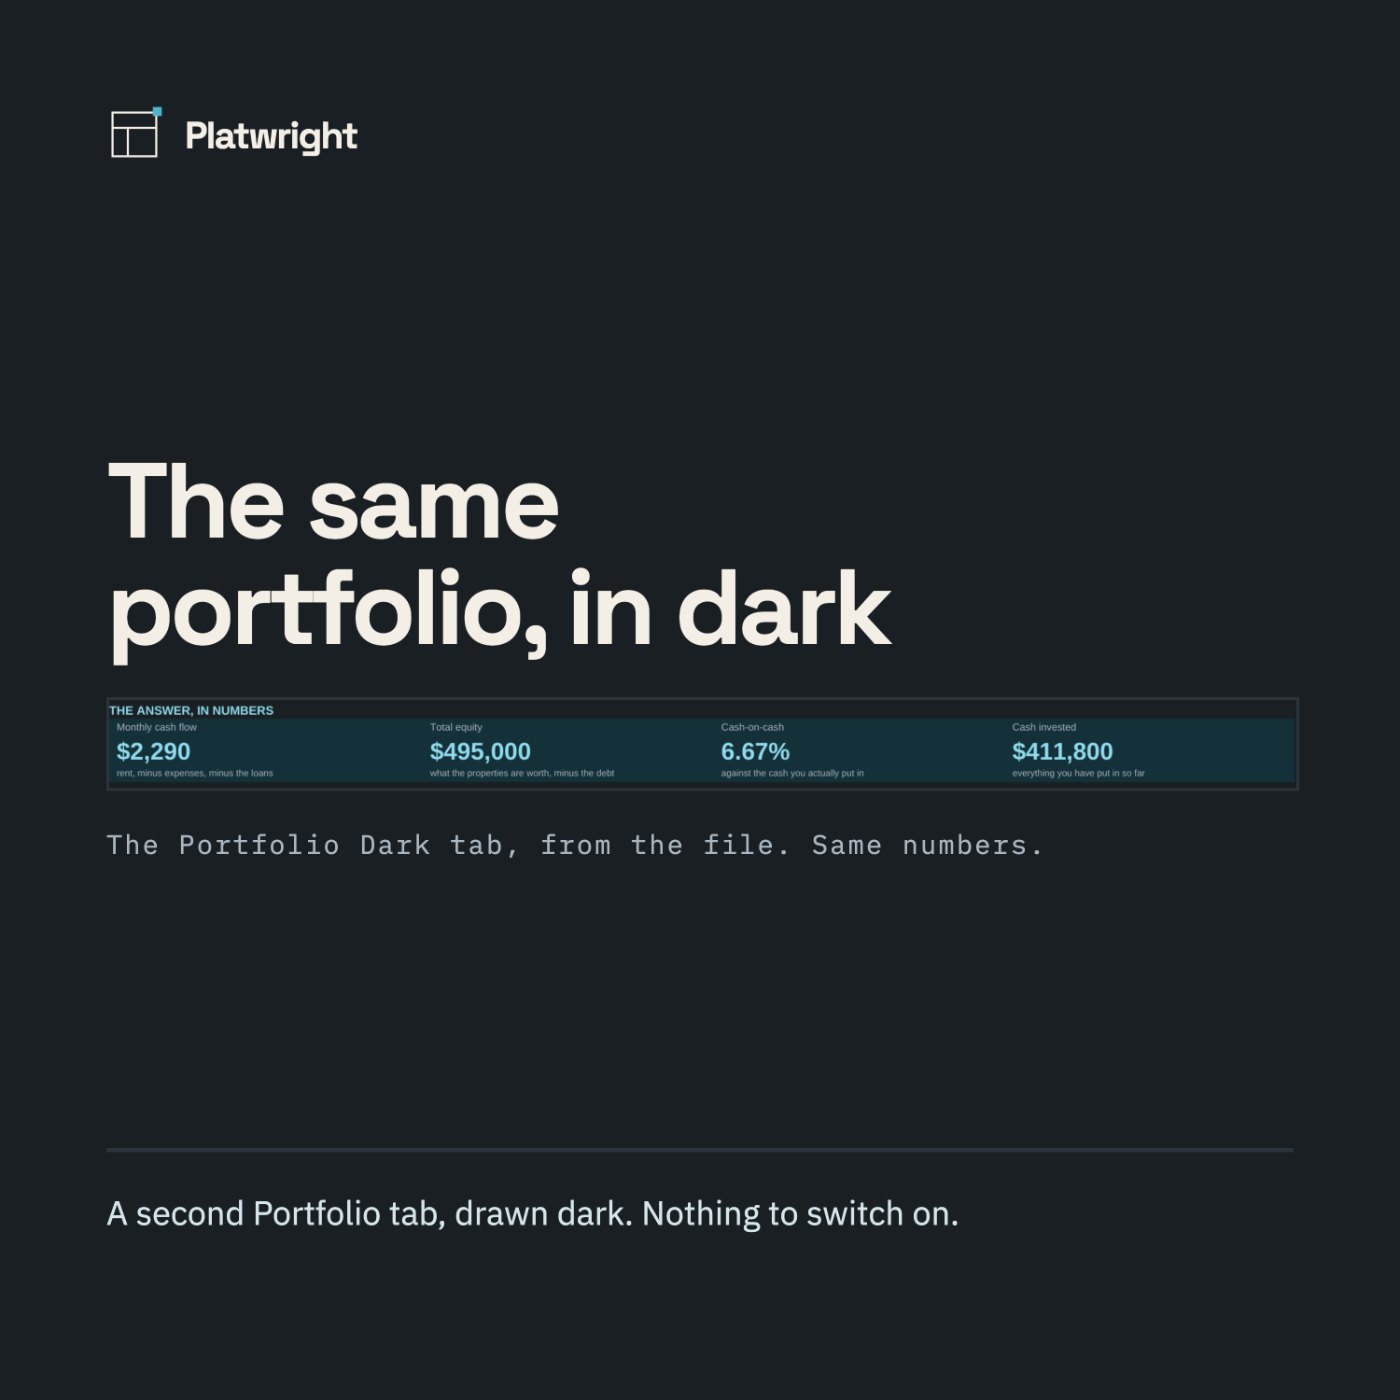
- Four headline numbers: monthly cash flow · total equity · cash-on-cash · cash invested
- Ten supporting numbers behind them: properties counted, market value, what you paid, value above what you paid, debt, portfolio LTV, monthly rent, monthly expenses, monthly loan payments and cap rate (market)
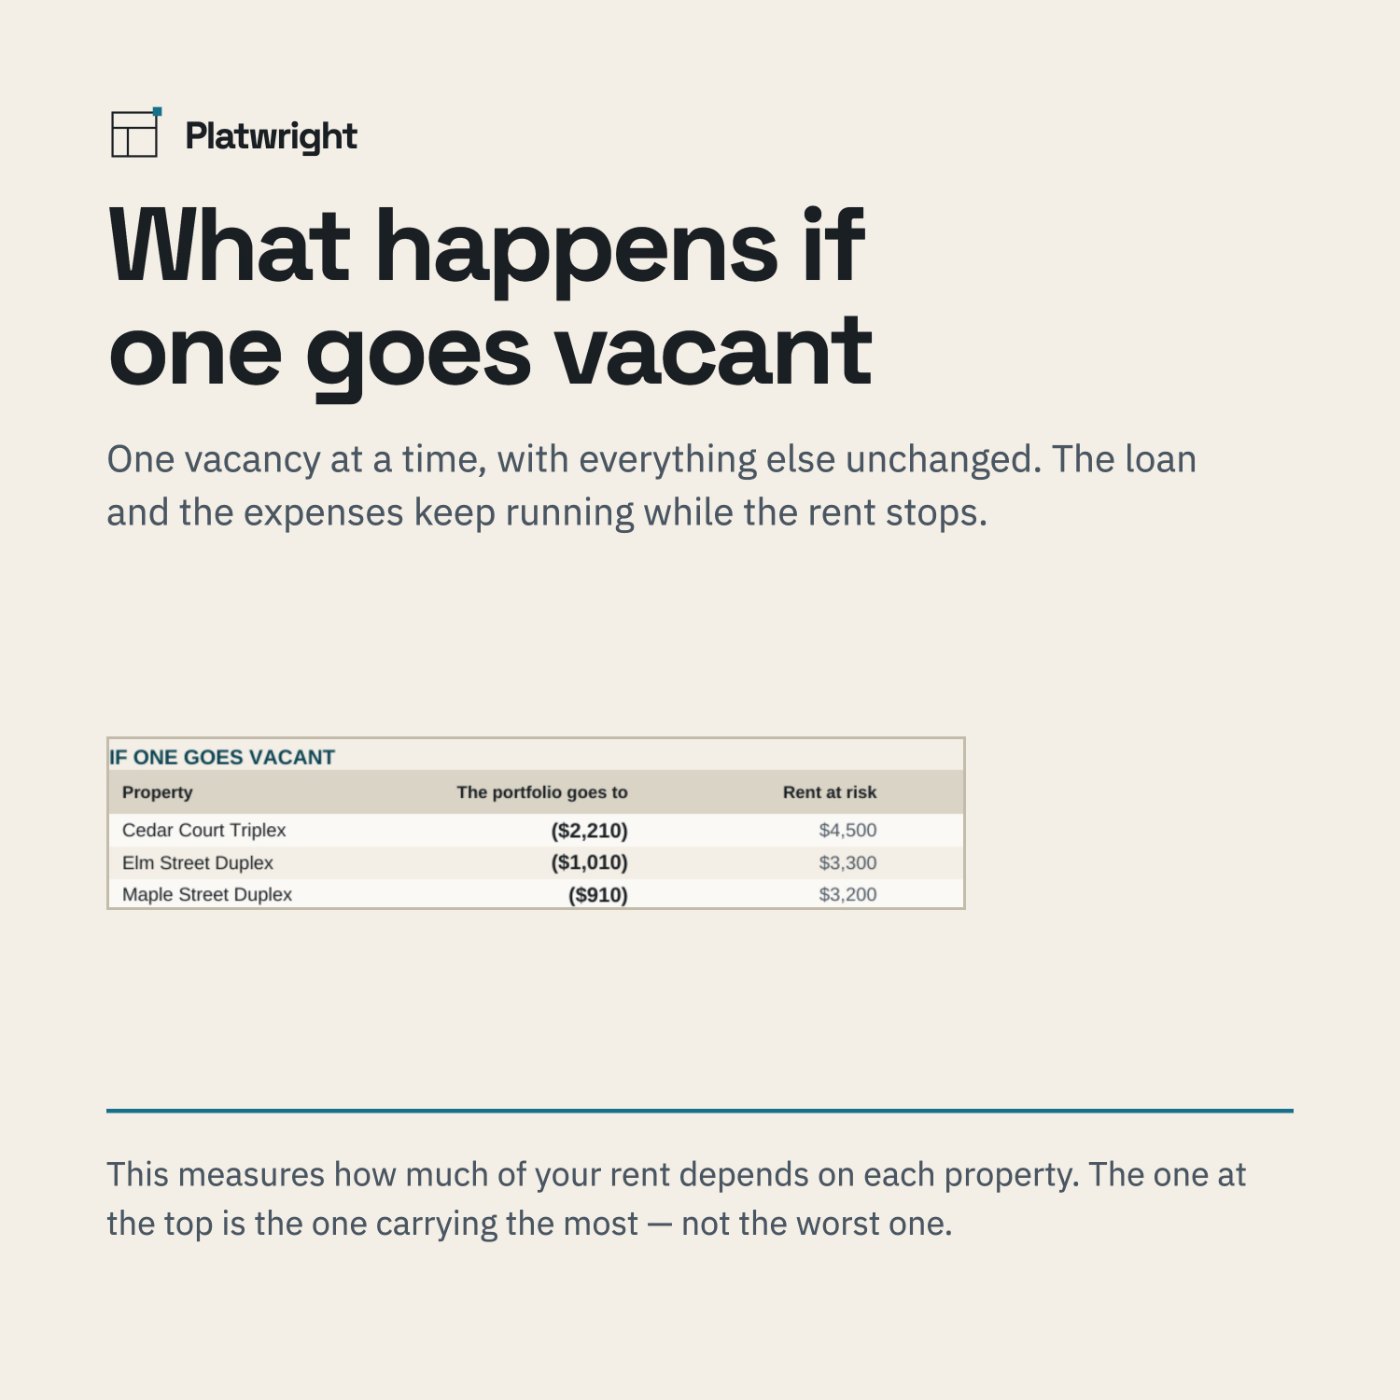
- If one goes vacant — the three properties your rent depends on the most, and what the portfolio total becomes in each case, one vacancy at a time with everything else unchanged
- All of them, in order — every property by monthly cash flow, with its cash-on-cash
- A dark Portfolio page, the same view drawn on a dark background — a second tab, nothing to switch on
- The Numbers, a tab that defines every figure, says where the file stops, and says what it cannot tell you
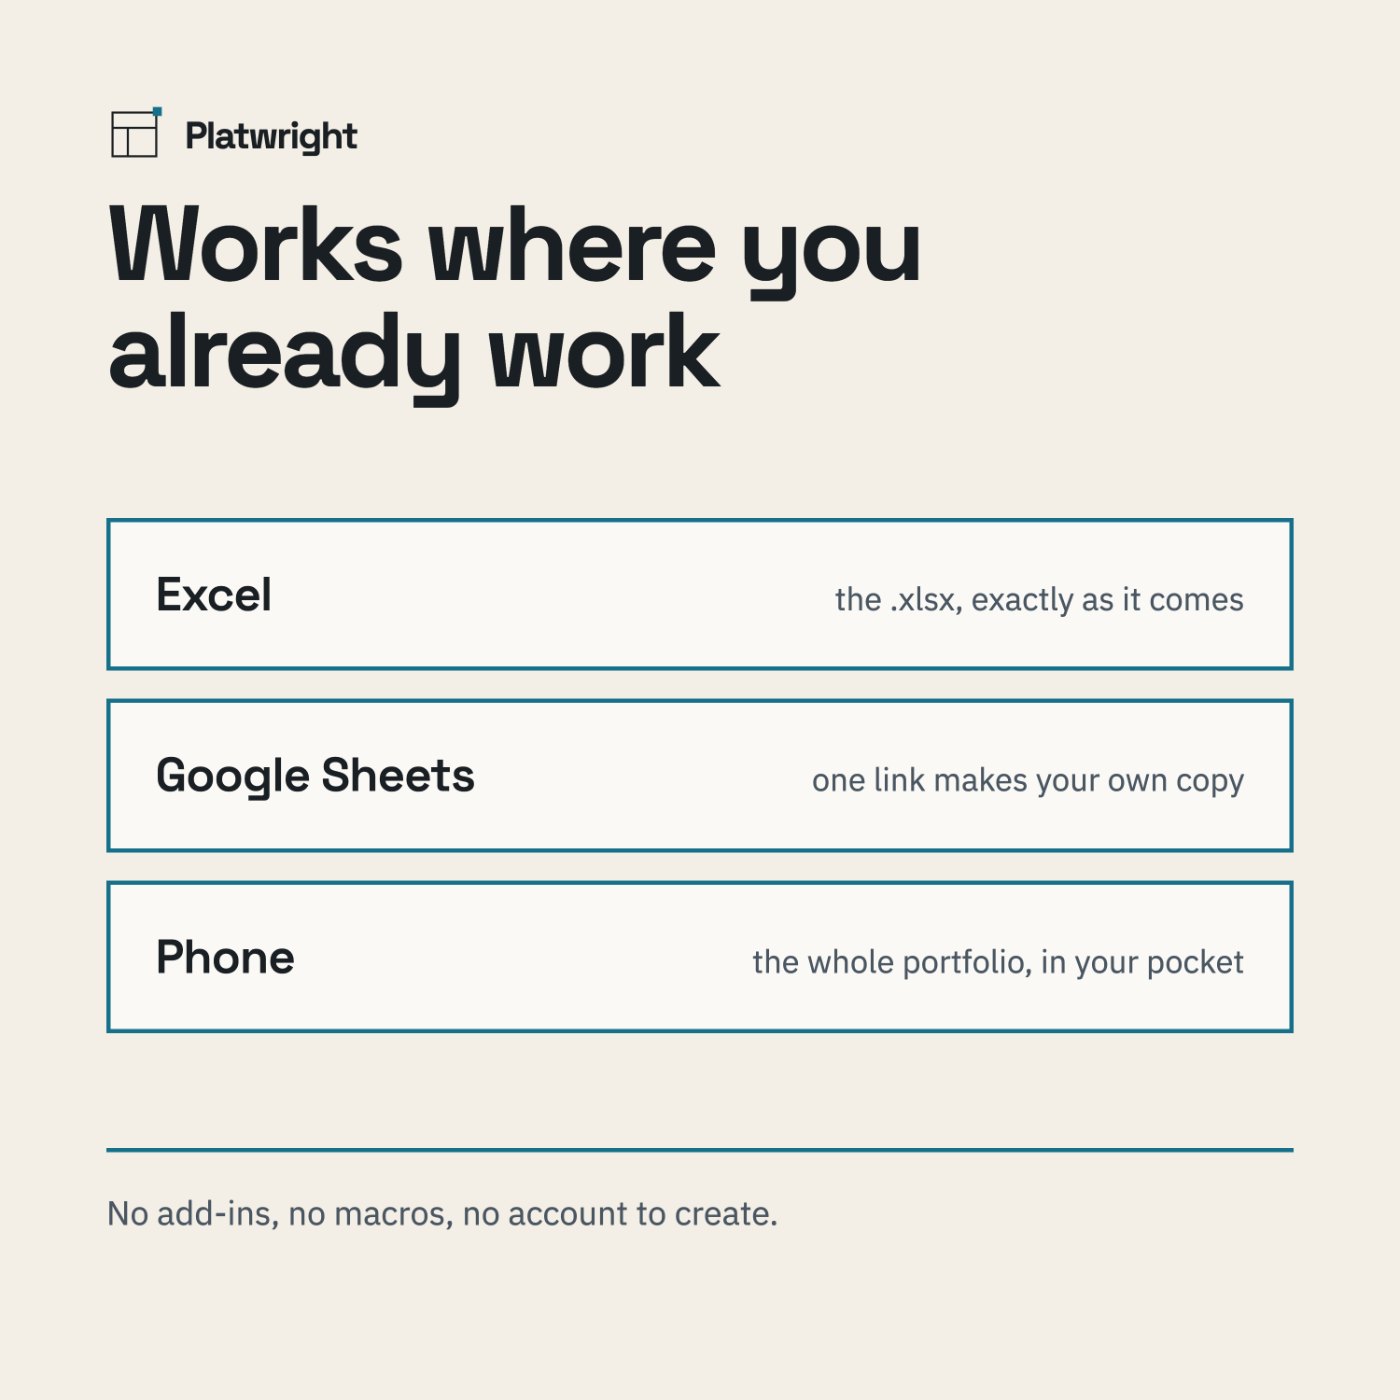
- Works in Excel and Google Sheets, desktop and mobile
- One payment. Yours to keep. No subscription
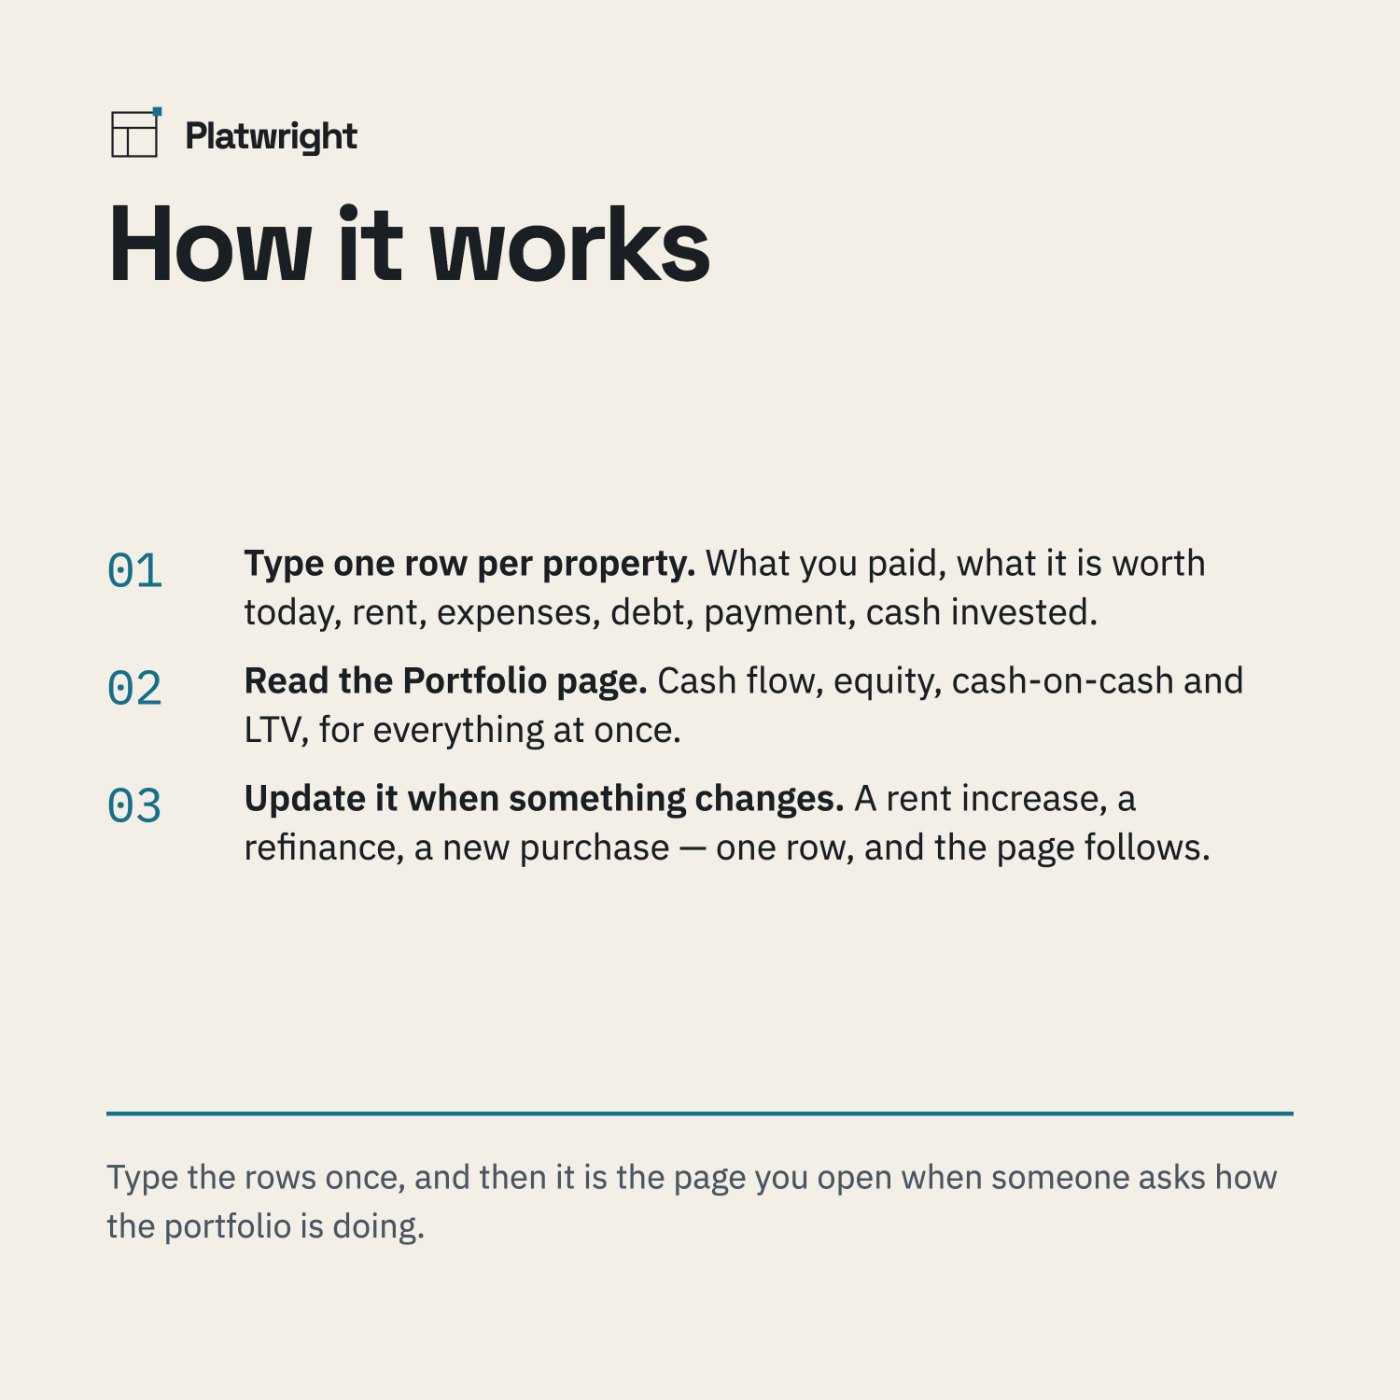
How it works
Type one row per property
What you paid, what it is worth today, rent, expenses, debt, payment, cash invested.
Read the Portfolio page
Cash flow, equity, cash-on-cash and LTV, for everything at once.
Update it when something changes
A rent increase, a refinance, a new purchase — one row, and the page follows.
What you see before you pay
Screenshots of the file below, with the worked example that comes loaded in it, alongside panels that spell out what is inside.
Compatibility
Microsoft Excel · Google Sheets · both mobile apps. No add-ins, no macros, no account to create. Formulas are open — you can see every calculation.
Questions
Do I need Excel?
No. The file opens in Google Sheets and in the Excel mobile app, and behaves the same in both.
Is this a subscription?
No. One payment, and the file is yours to keep. There is nothing to renew.
Can I edit it?
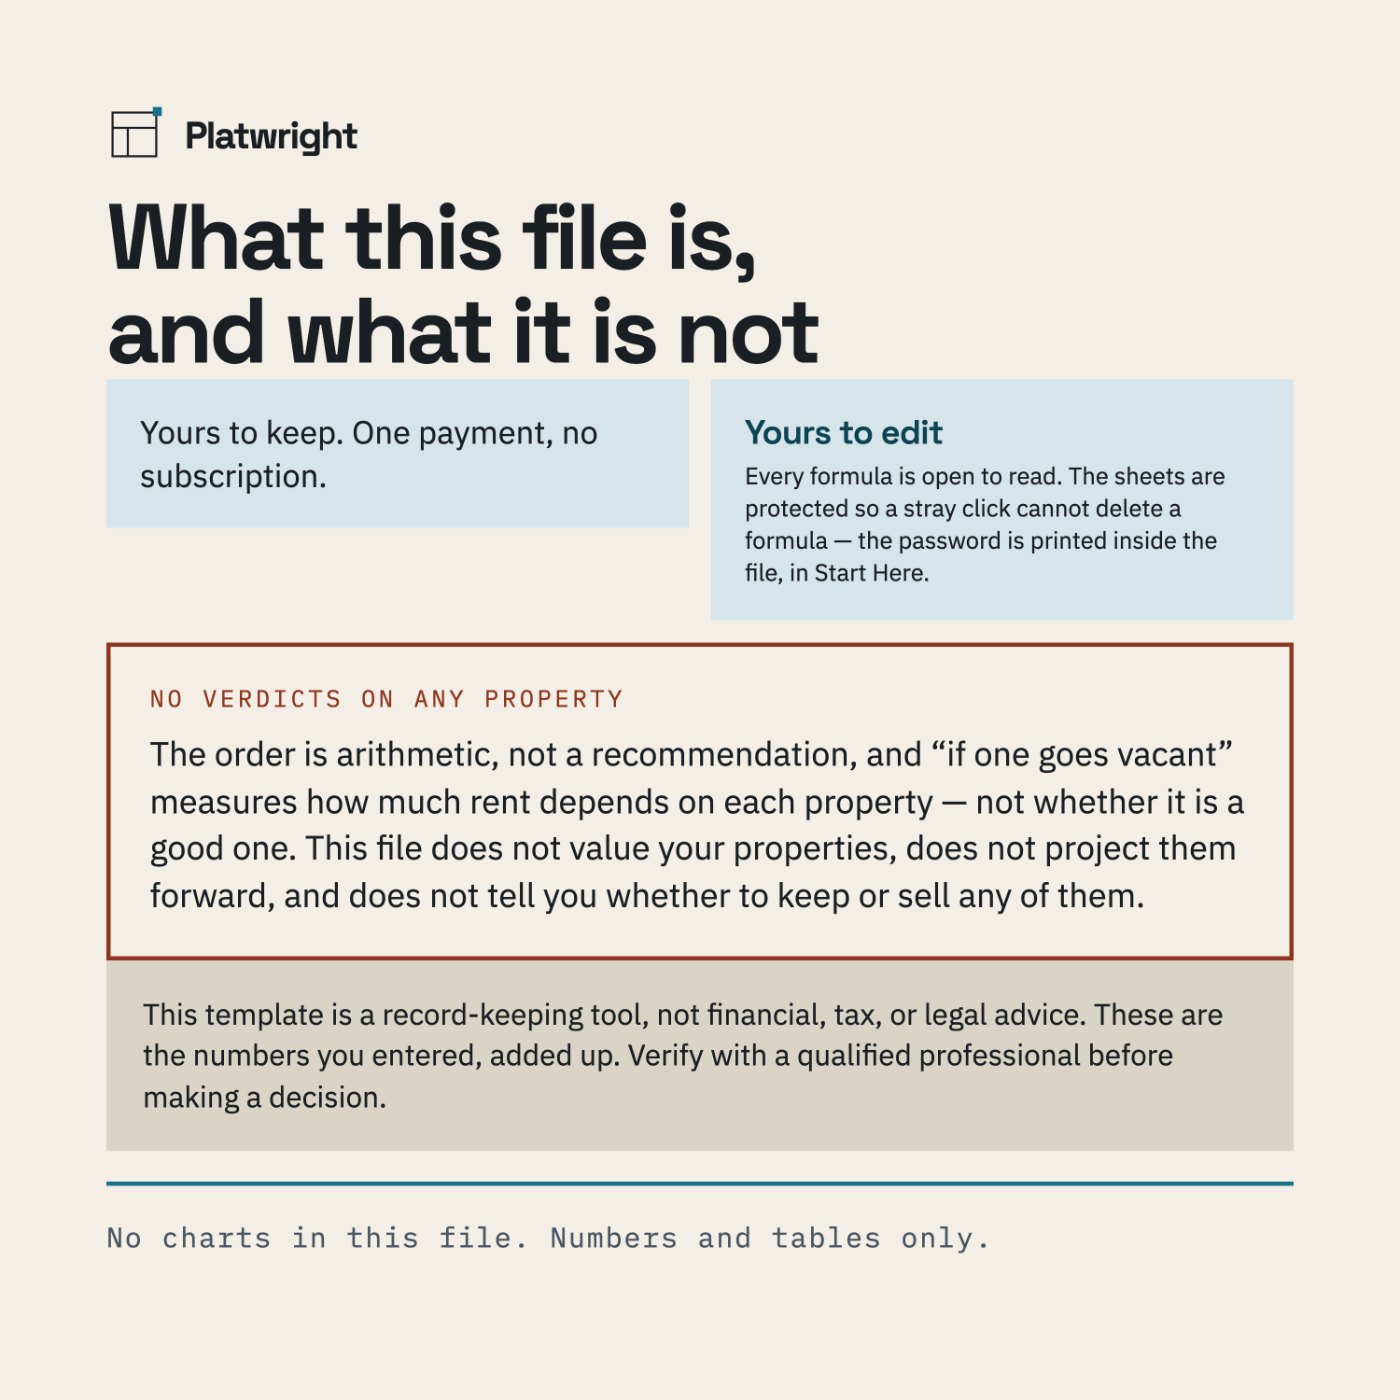
Yes. Every formula is open to read. The sheets are protected so a stray click cannot delete a formula. In Excel: Review > Unprotect Sheet. The password is printed inside the file, in Start Here. In Google Sheets: you own your copy, so you can edit anything — Sheets will just ask you to confirm first.
How many properties does it hold?
Ten, and the tenth is the last one. Type over the empty rows that are already there — do not insert rows, because the totals use fixed cell references and inserting rows breaks them.
Does it analyze a property I am thinking of buying?
No. This file measures what you already own. For a purchase, use the Rental Property Analyzer; to line several candidates up against each other, use the free Deal Screener.
Does "if one goes vacant" mean that property is a bad one?
No. It measures how much of your rent depends on each property, so the one at the top is usually the one carrying the most, not the worst one. The ranking below it is arithmetic too, not a recommendation.
Can I use this for my taxes?
No. These are the numbers you entered, added up — not a tax return, and no form is filled. See the disclaimer below, and take your numbers to a qualified professional.
The worked example, in full
Every figure this file produces is written out on a page of its own — the numbers you type, the arithmetic in between, and what comes out the other side. Nothing is rounded to make a point.
- Five properties on one page — the portfolio view, and the vacancy column.
Everything you own, on one page
One payment of $34, and the file is yours to keep. No subscription, nothing to renew — and a one-page Welcome Guide arrives with it.
Checkout is handled by Payhip, our payment processor, so you will leave platwright.com to pay. The file and the Welcome Guide arrive by email the moment the payment clears. If anything goes wrong with the download, email platwrightdr@gmail.com and I will sort it.
This template is a record-keeping tool, not financial, tax, or legal advice. These are the numbers you entered, added up. Verify with a qualified professional before making a decision.