 Platwright
#1 · Template · v1.0
Rental Property Analyzer — Excel & Google Sheets Template for One Property, Up to 8 Units
A rental deal looks fine until you add the vacancy, the management fee, the repairs and the capital reserve — and then it looks like something else. Most spreadsheets stop at the mortgage payment.
One-time purchase $39
Works in Excel and Google Sheets. One payment, yours to keep.
Checkout is handled by Payhip, our payment processor, so you will leave platwright.com to pay. The file and the Welcome Guide arrive by email the moment the payment clears. If anything goes wrong with the download, email platwrightdr@gmail.com and I will sort it.
What the file does
Rental Property Analyzer takes one property with up to eight rental units and works it all the way through: what it earns, what it costs to run, what the loan takes, and what is left. It shows you the same property three ways — base, downside, and upside — projects thirty years, and lays out every payment of the loan with a column where you can type extra payments and watch the schedule change. Every metric it prints is also explained, in a tab of its own, including where that metric misleads.
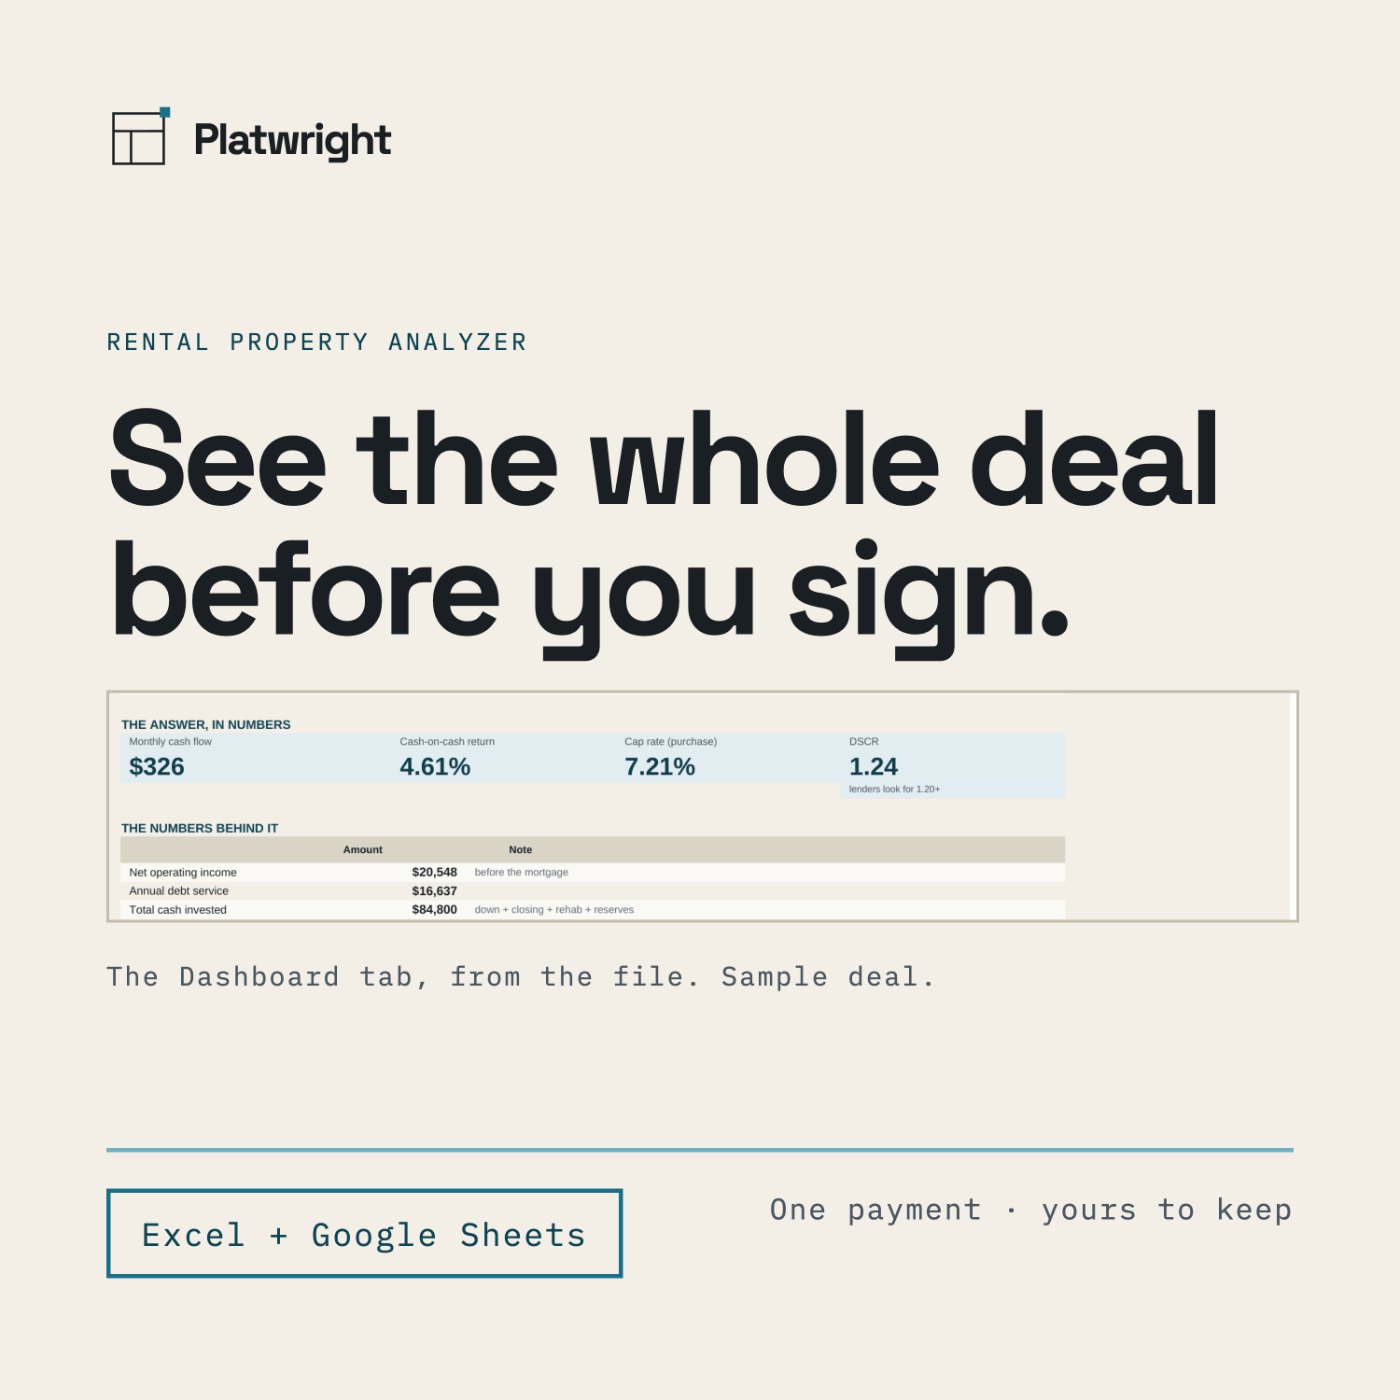
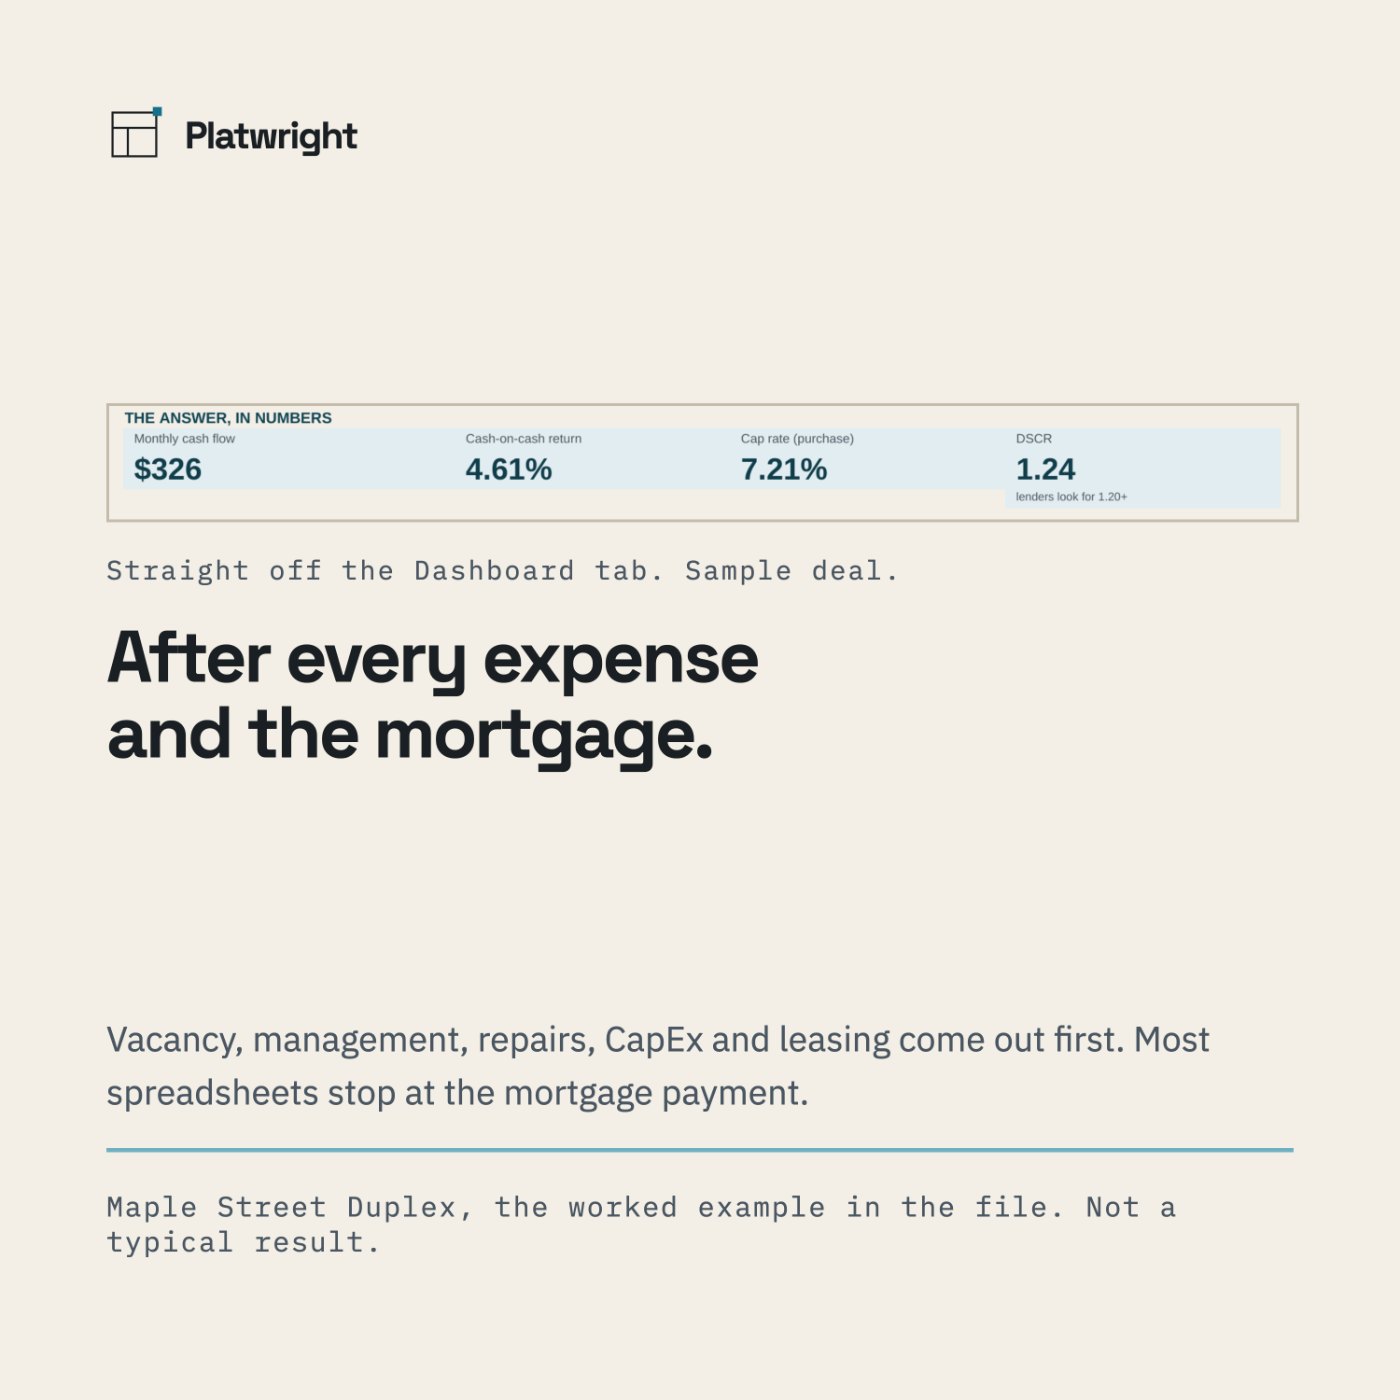
The number
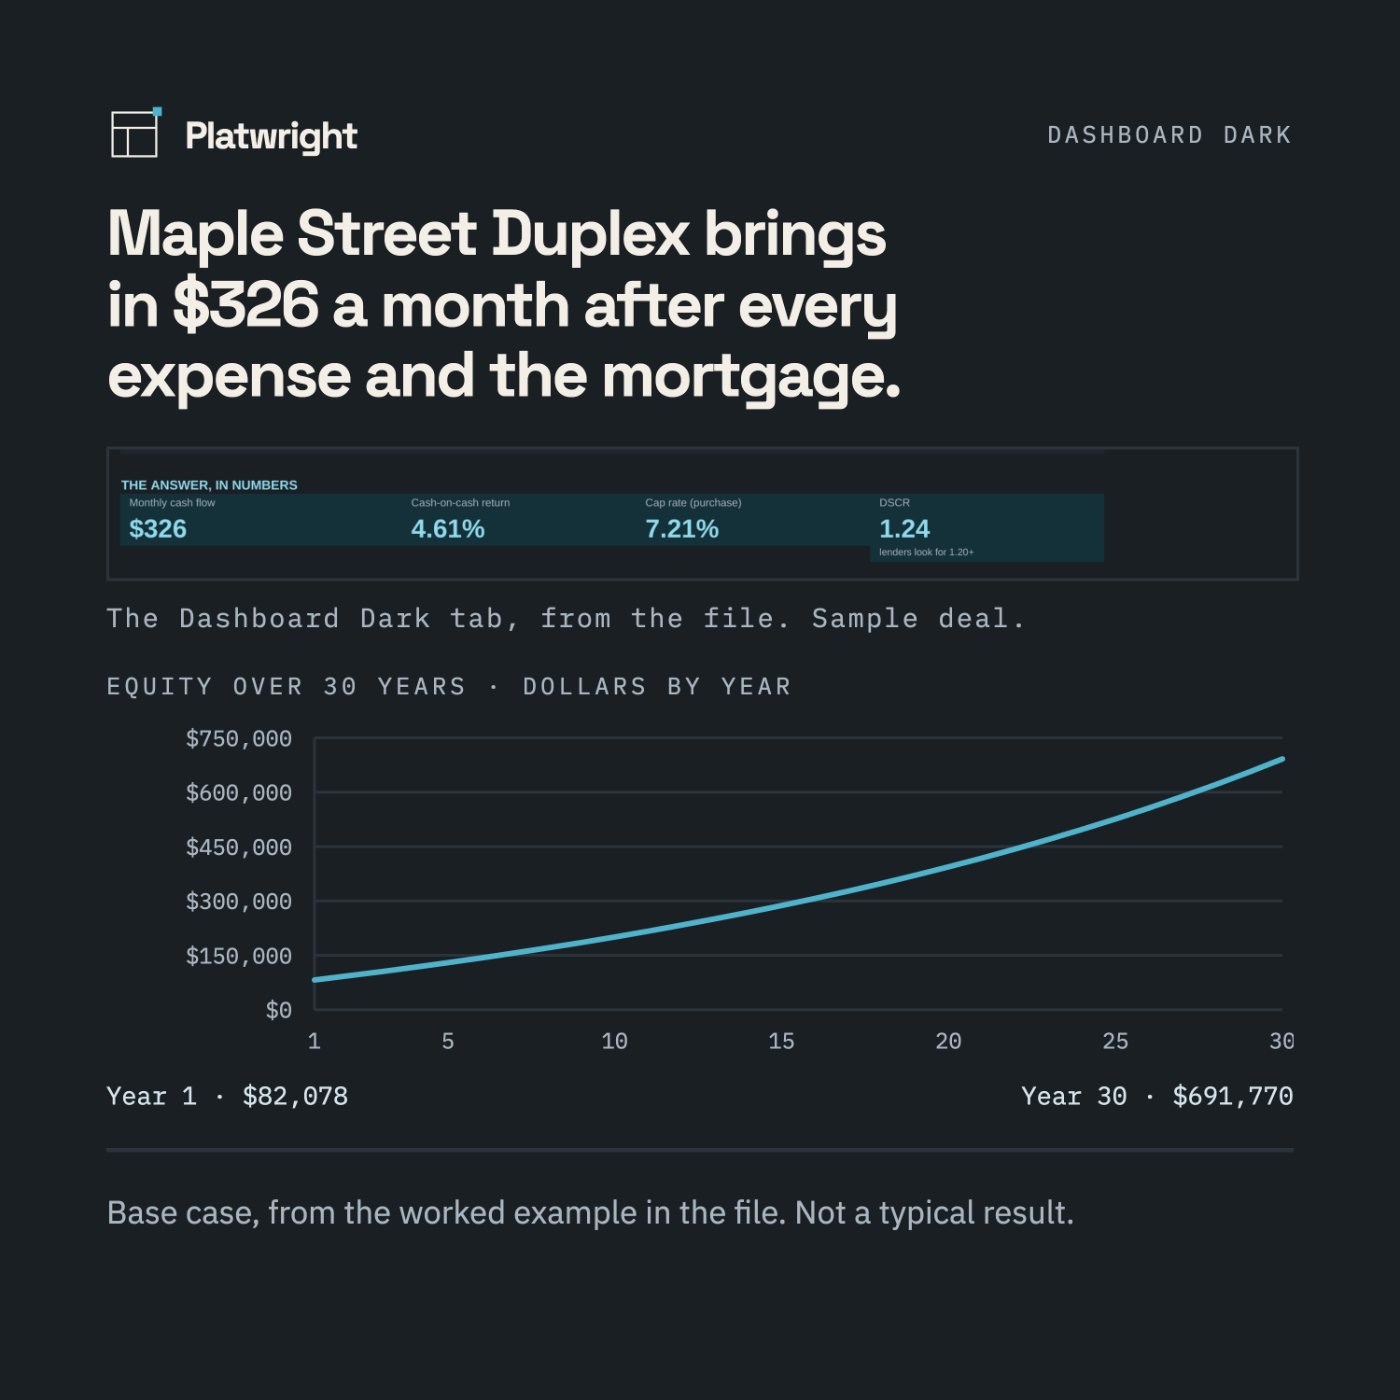
$326
Monthly cash flow after every expense and the mortgage
Sample deal, from the file. Not a typical result.
What's included
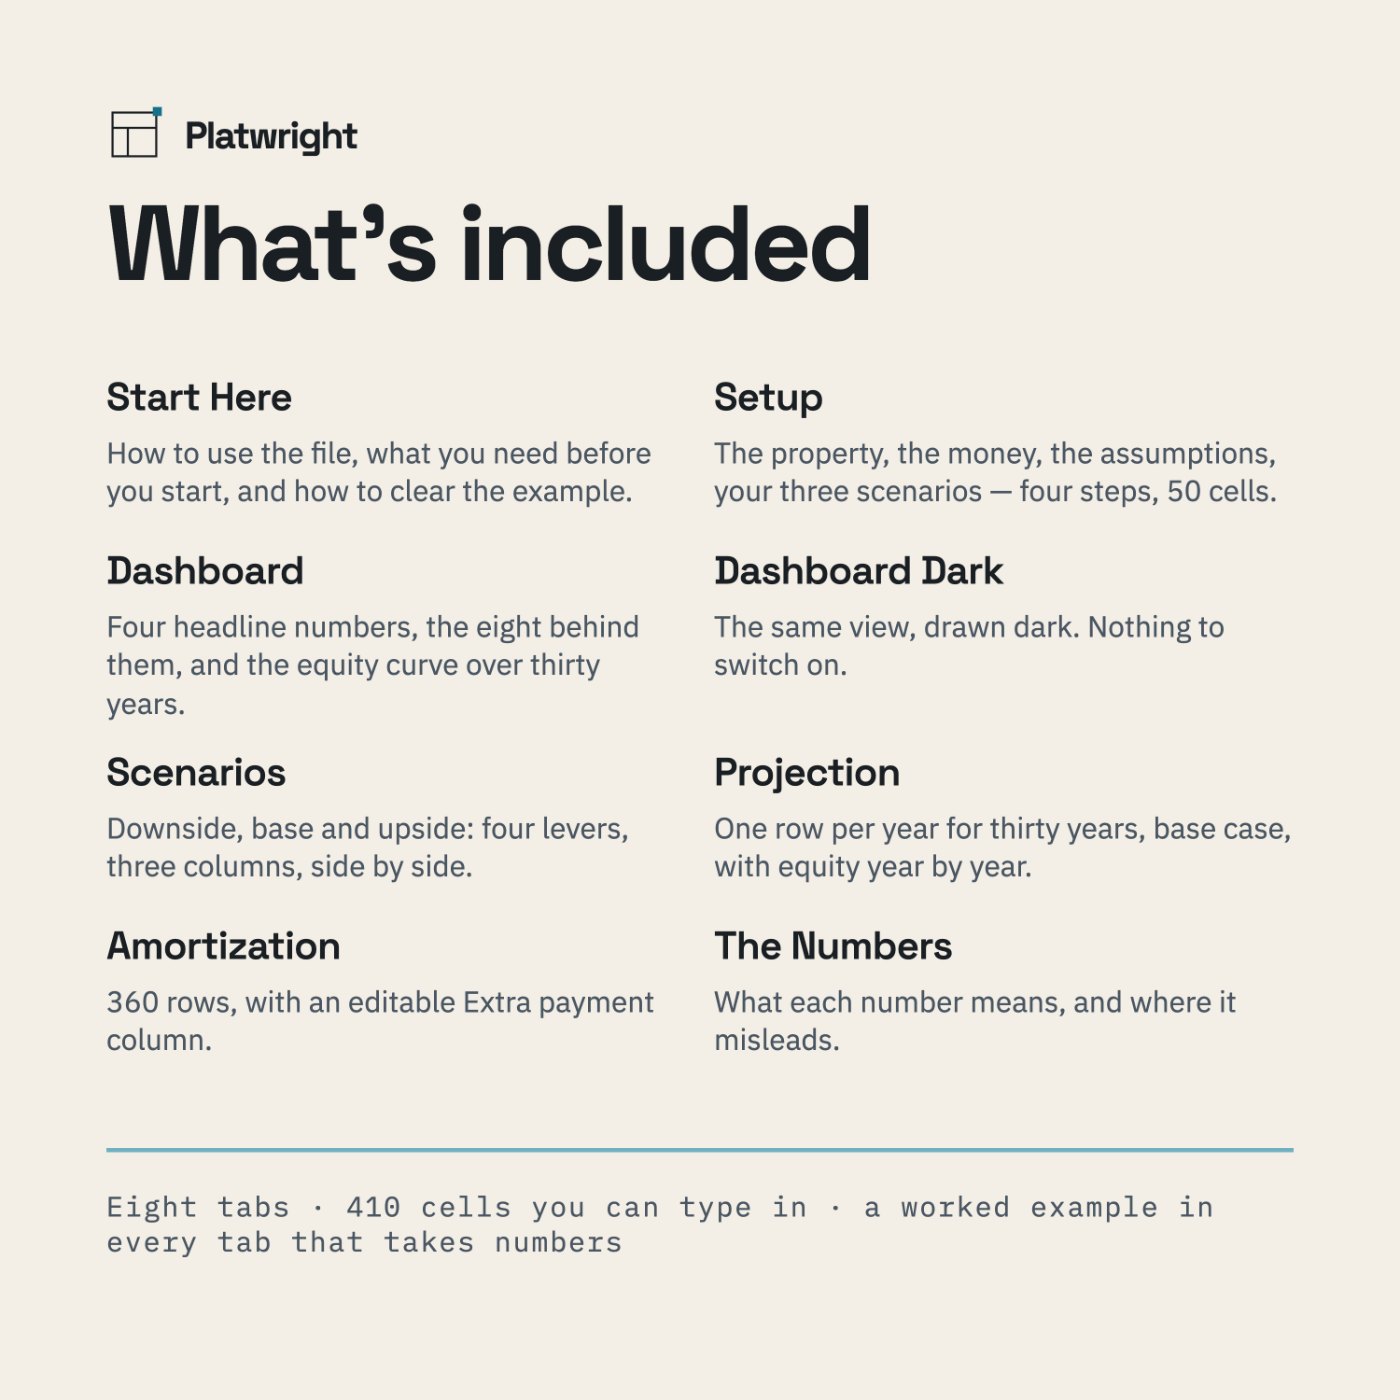
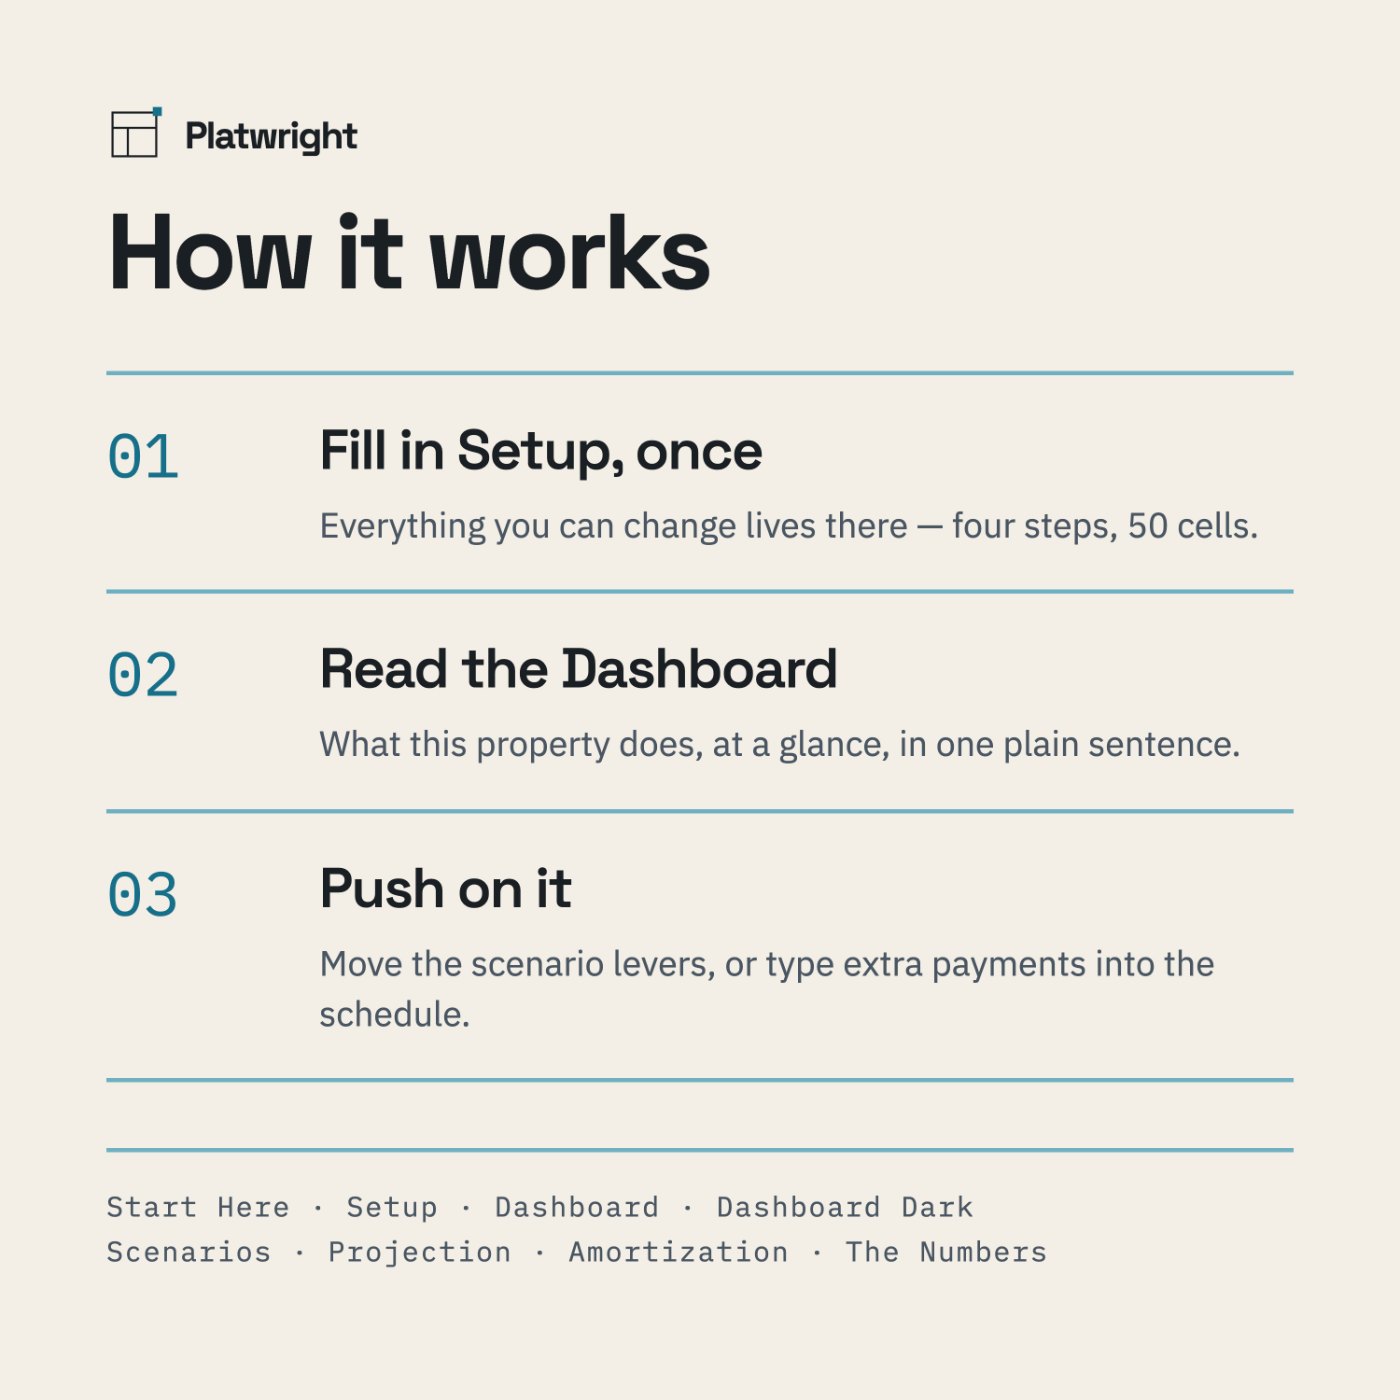
- Eight tabs: Start Here · Setup · Dashboard · Dashboard Dark · Scenarios · Projection · Amortization · The Numbers
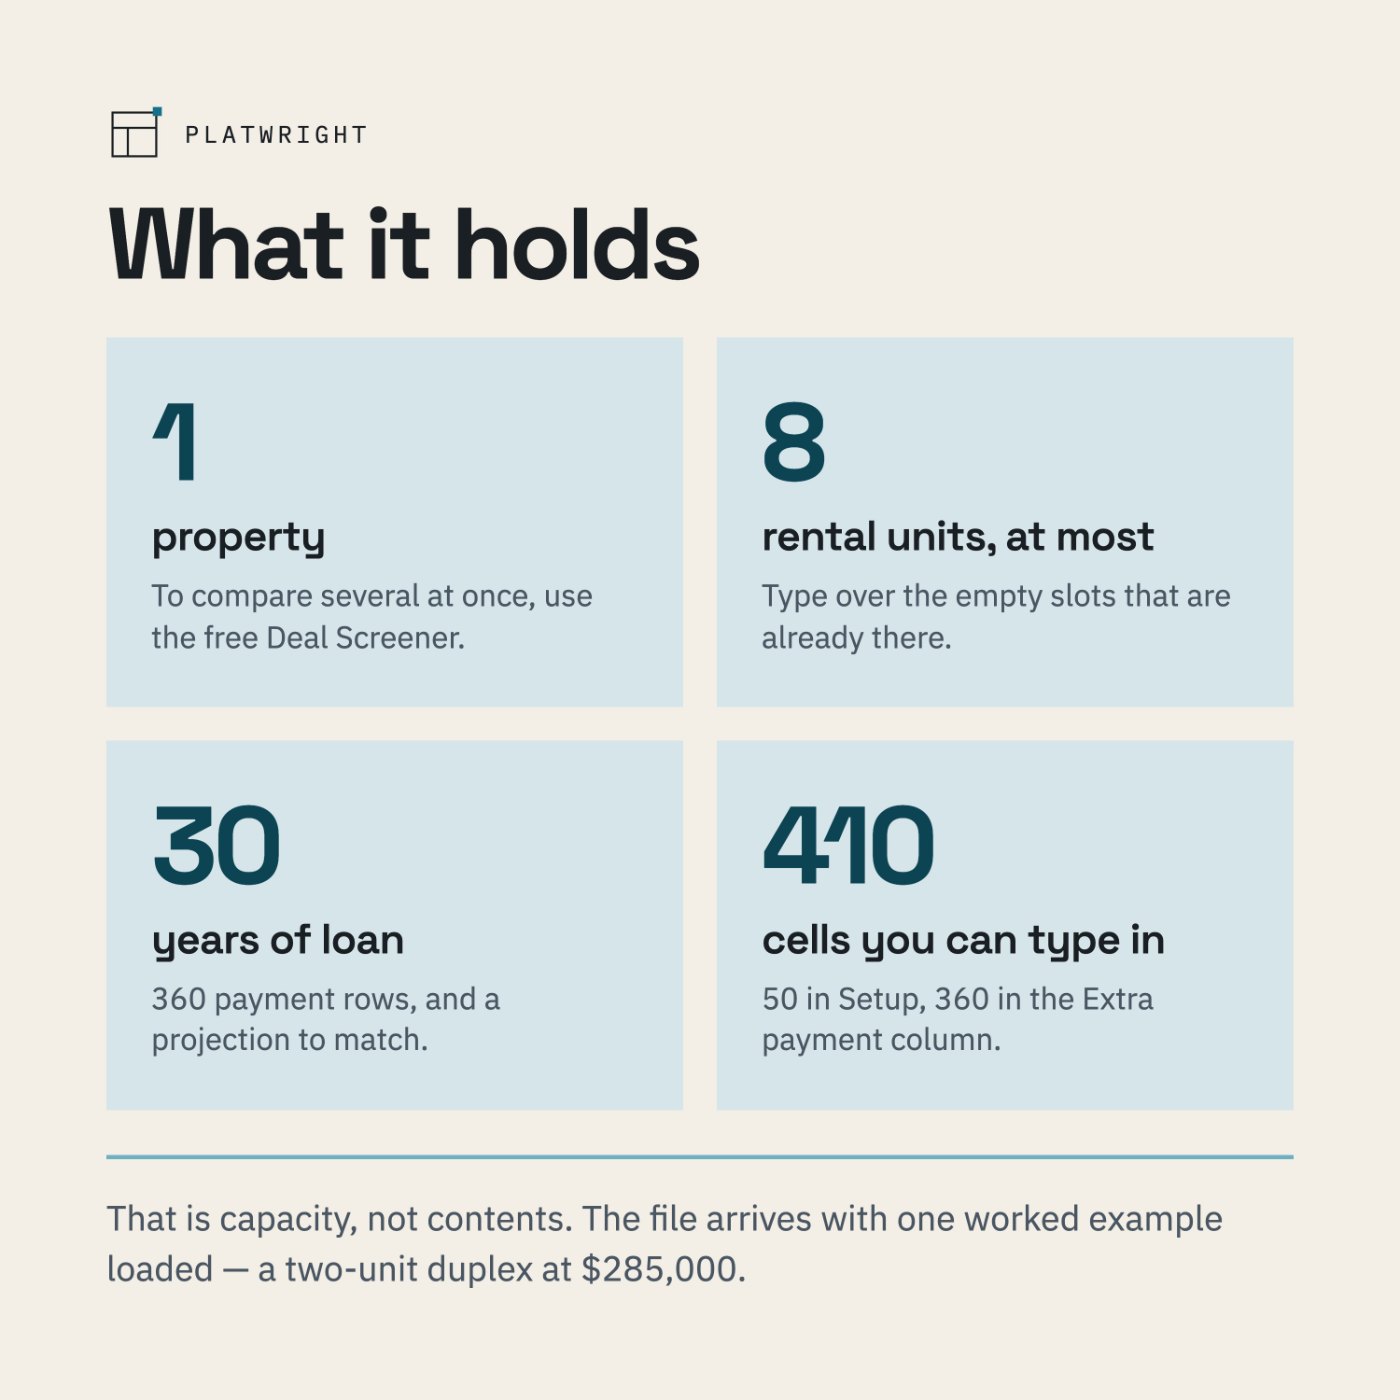
- One property, up to eight rental units. Loans up to 30 years
- 410 cells you can type in — 50 in Setup, 360 in the Extra payment column of the Amortization schedule
- A worked example already loaded, so nothing is ever blank
- Four headline numbers: monthly cash flow · cash-on-cash return · cap rate (purchase) · DSCR
- Eight supporting numbers behind them: net operating income, annual debt service, total cash invested, effective gross income, operating expenses, gross rent multiplier, break-even occupancy, and the 1% rule
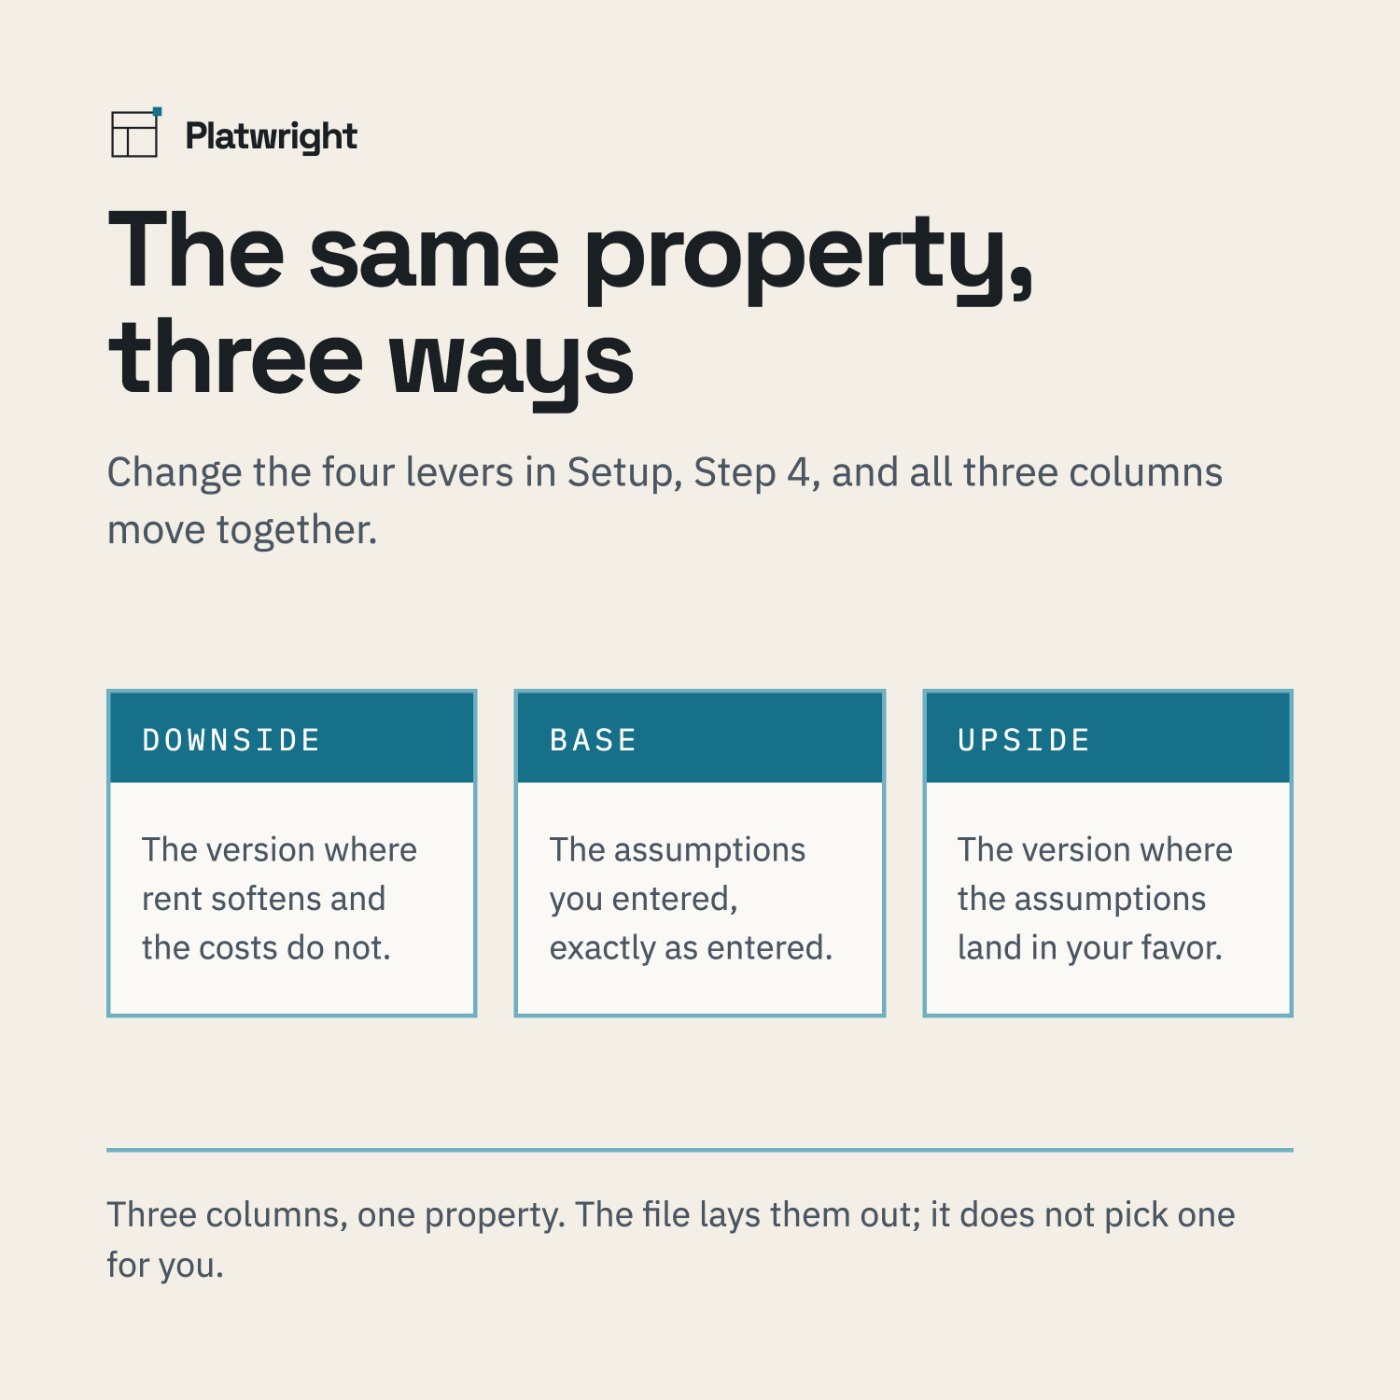
- Three scenarios side by side — base, downside, upside — driven by four levers you set in Setup, Step 4
- A 30-year projection, one row per year
- A full amortization schedule, 360 rows, with an editable Extra payment column
- An equity chart over 30 years — the base case, from $82,078 in year one to $691,770 in year thirty, with both axes numbered
- Protected sheets, password inside the file — every formula stays readable
- A dark dashboard, the same view on a dark background
- The Numbers, a metrics guide defining net operating income, cap rate (purchase), cap rate (market), cash-on-cash return, break-even occupancy, gross rent multiplier, the 1% rule, CapEx reserve, return on equity, and the terms you will hear that this file does not calculate
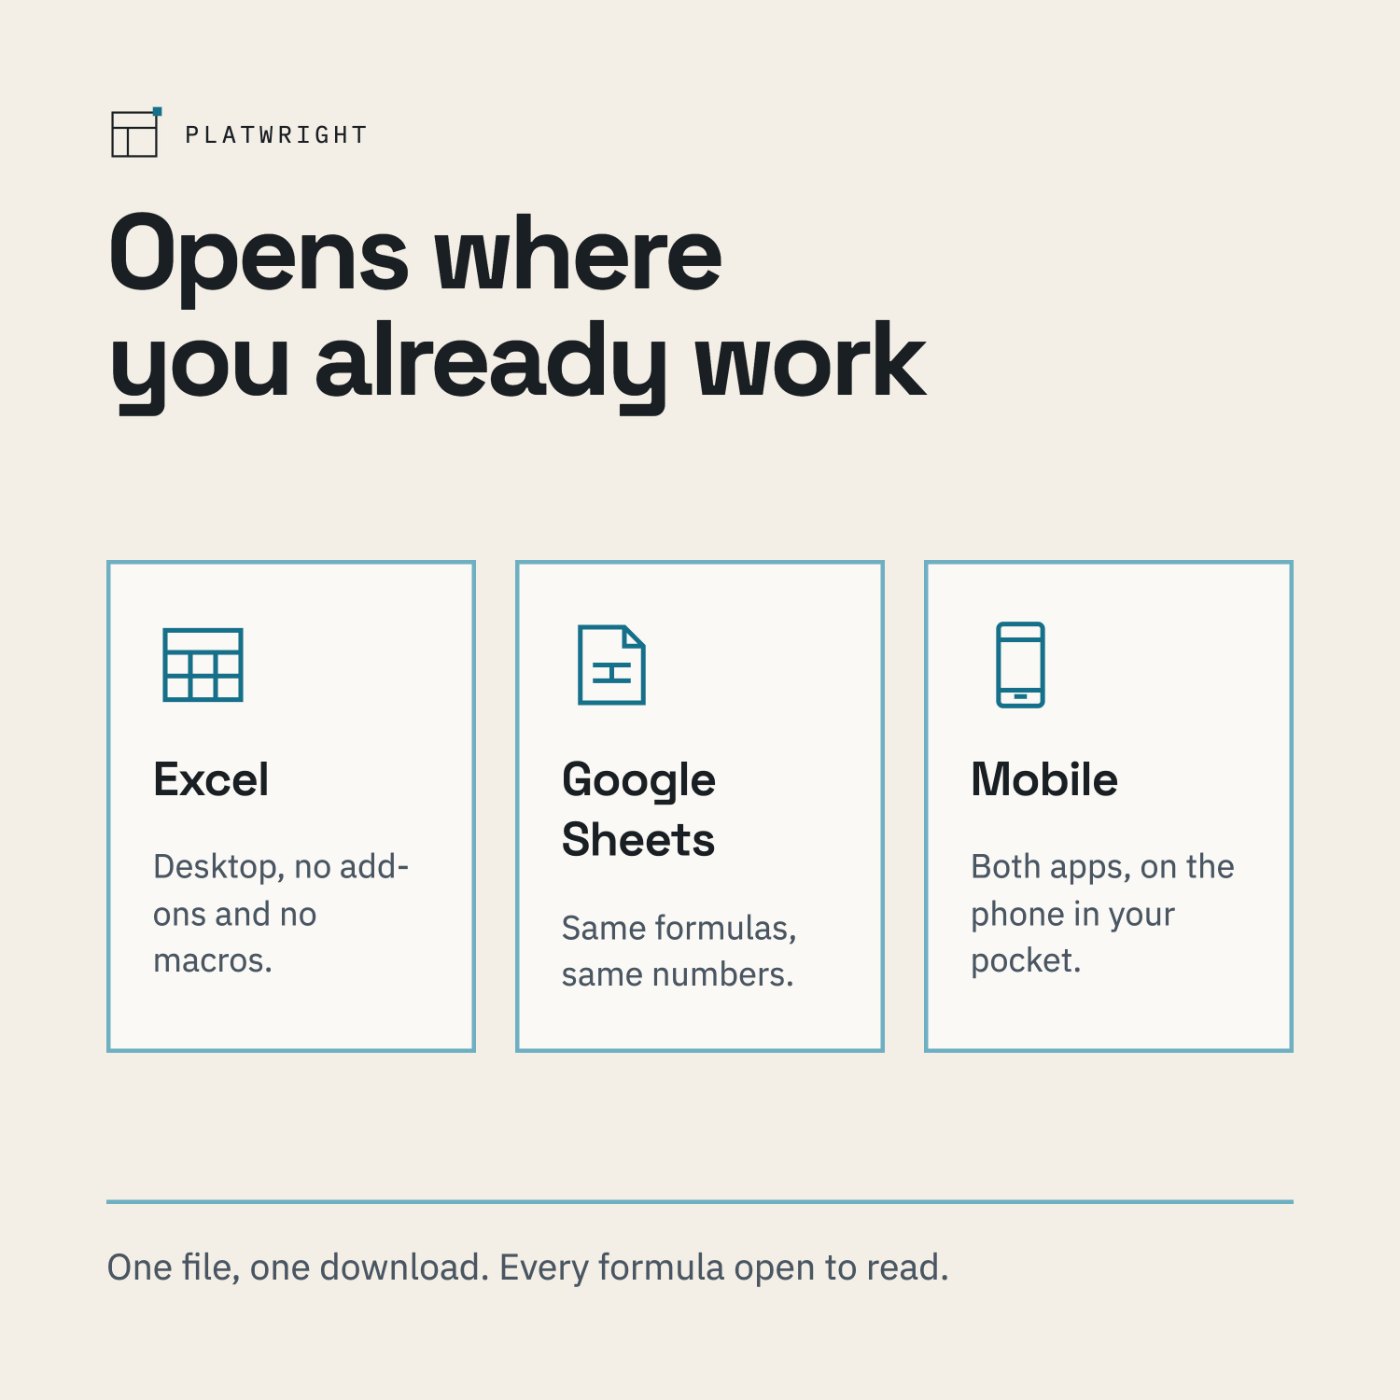
- Works in Excel and Google Sheets, desktop and mobile
- One payment. Yours to keep. No subscription
How it works
Setup, once
Four steps: the property, the money, income and operating expenses and growth assumptions, and your three scenarios.
Read the Dashboard
Four numbers up top, eight underneath, and a line that tells you in plain words what the property does each month.
Push on it
Change the four scenario levers, or type extra payments into the amortization column, and watch what moves.
What you see before you pay
Screenshots of the file below, with the worked example that comes loaded in it, alongside panels that spell out what is inside.
Compatibility
Microsoft Excel · Google Sheets · both mobile apps. No add-ons, no macros. Formulas are open — you can see every calculation.
Questions
Do I need Excel?
No. The file opens in Google Sheets and in the Excel mobile app, and behaves the same in both.
Is this a subscription?
No. One payment, and the file is yours to keep. There is nothing to renew.
Can I edit it?
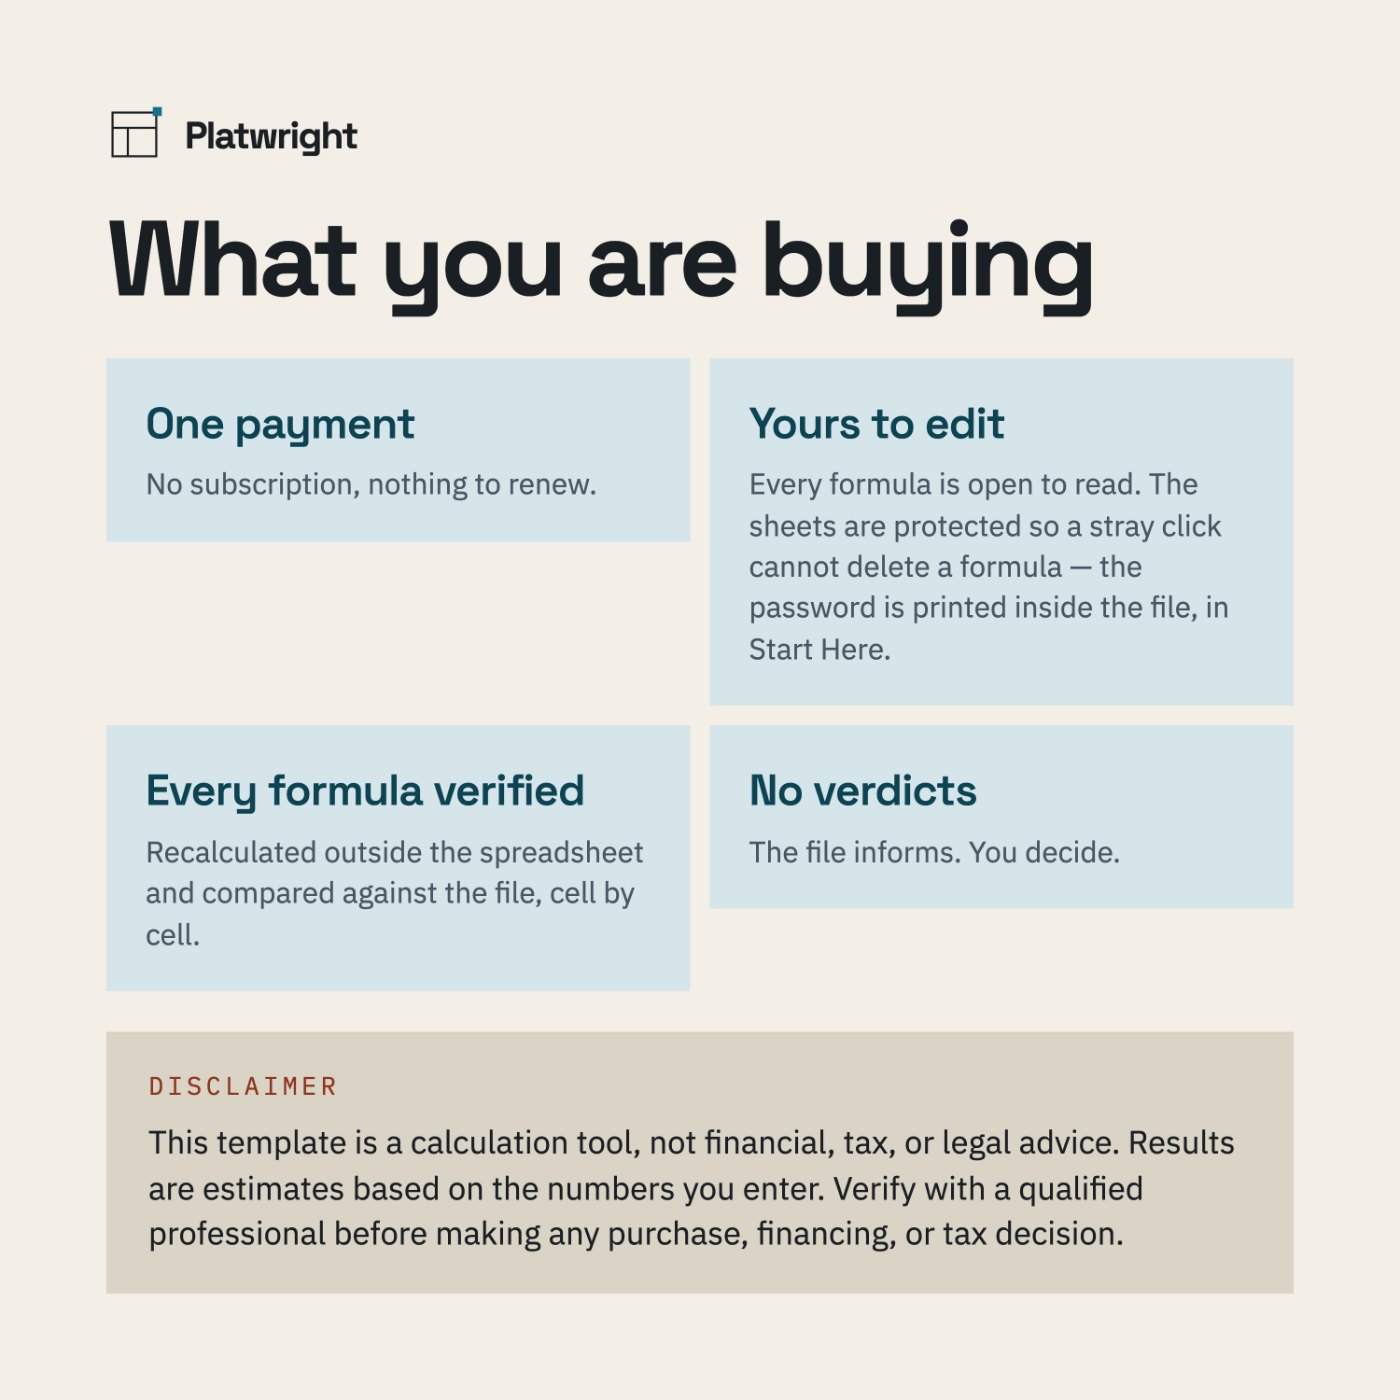
Yes. Every formula is open to read. The sheets are protected so a stray click cannot delete a formula. In Excel: Review > Unprotect Sheet. The password is printed inside the file, in Start Here. In Google Sheets: you own your copy, so you can edit anything — Sheets will just ask you to confirm first.
Does it handle more than one property?
No — this file is one property with up to eight rental units. To line several properties up against each other, use the free Deal Screener.
How do I add a unit or a line item?
Type over the empty slots that are already there. Do not insert rows: the engine uses fixed cell references and inserting rows breaks them.
Can I use this for my taxes?
No. It is a calculation tool. See the disclaimer below, and take your numbers to a qualified professional.
Does it tell me whether the deal is good?
No. It shows you what the deal does, including the version where it goes wrong. Nothing in the file approves or rejects a property.
The worked example, in full
Every figure this file produces is written out on a page of its own — the numbers you type, the arithmetic in between, and what comes out the other side. Nothing is rounded to make a point.
- How to run a duplex through a spreadsheet — one property, worked from the six numbers you type down to the four that decide.
One property, all the way through
One payment of $39, and the file is yours to keep. No subscription, nothing to renew — and a one-page Welcome Guide arrives with it.
Checkout is handled by Payhip, our payment processor, so you will leave platwright.com to pay. The file and the Welcome Guide arrive by email the moment the payment clears. If anything goes wrong with the download, email platwrightdr@gmail.com and I will sort it.
This template is a calculation tool, not financial, tax, or legal advice. Results are estimates based on the numbers you enter. Verify with a qualified professional before making any purchase, financing, or tax decision.