 Platwright
#3 · Template · v1.0
Short-Term Rental Tracker — Excel & Google Sheets Template for Up to 3 Units, in Nights
A short-term rental month can look great and still be a bad month. The platform report gives you payouts, the calendar gives you nights, and neither one tells you what you kept — or what you gave up on the nights you never sold.
One-time purchase $39
Works in Excel and Google Sheets. One payment, yours to keep.
Checkout is handled by Payhip, our payment processor, so you will leave platwright.com to pay. The file and the Welcome Guide arrive by email the moment the payment clears. If anything goes wrong with the download, email platwrightdr@gmail.com and I will sort it.
What the file does
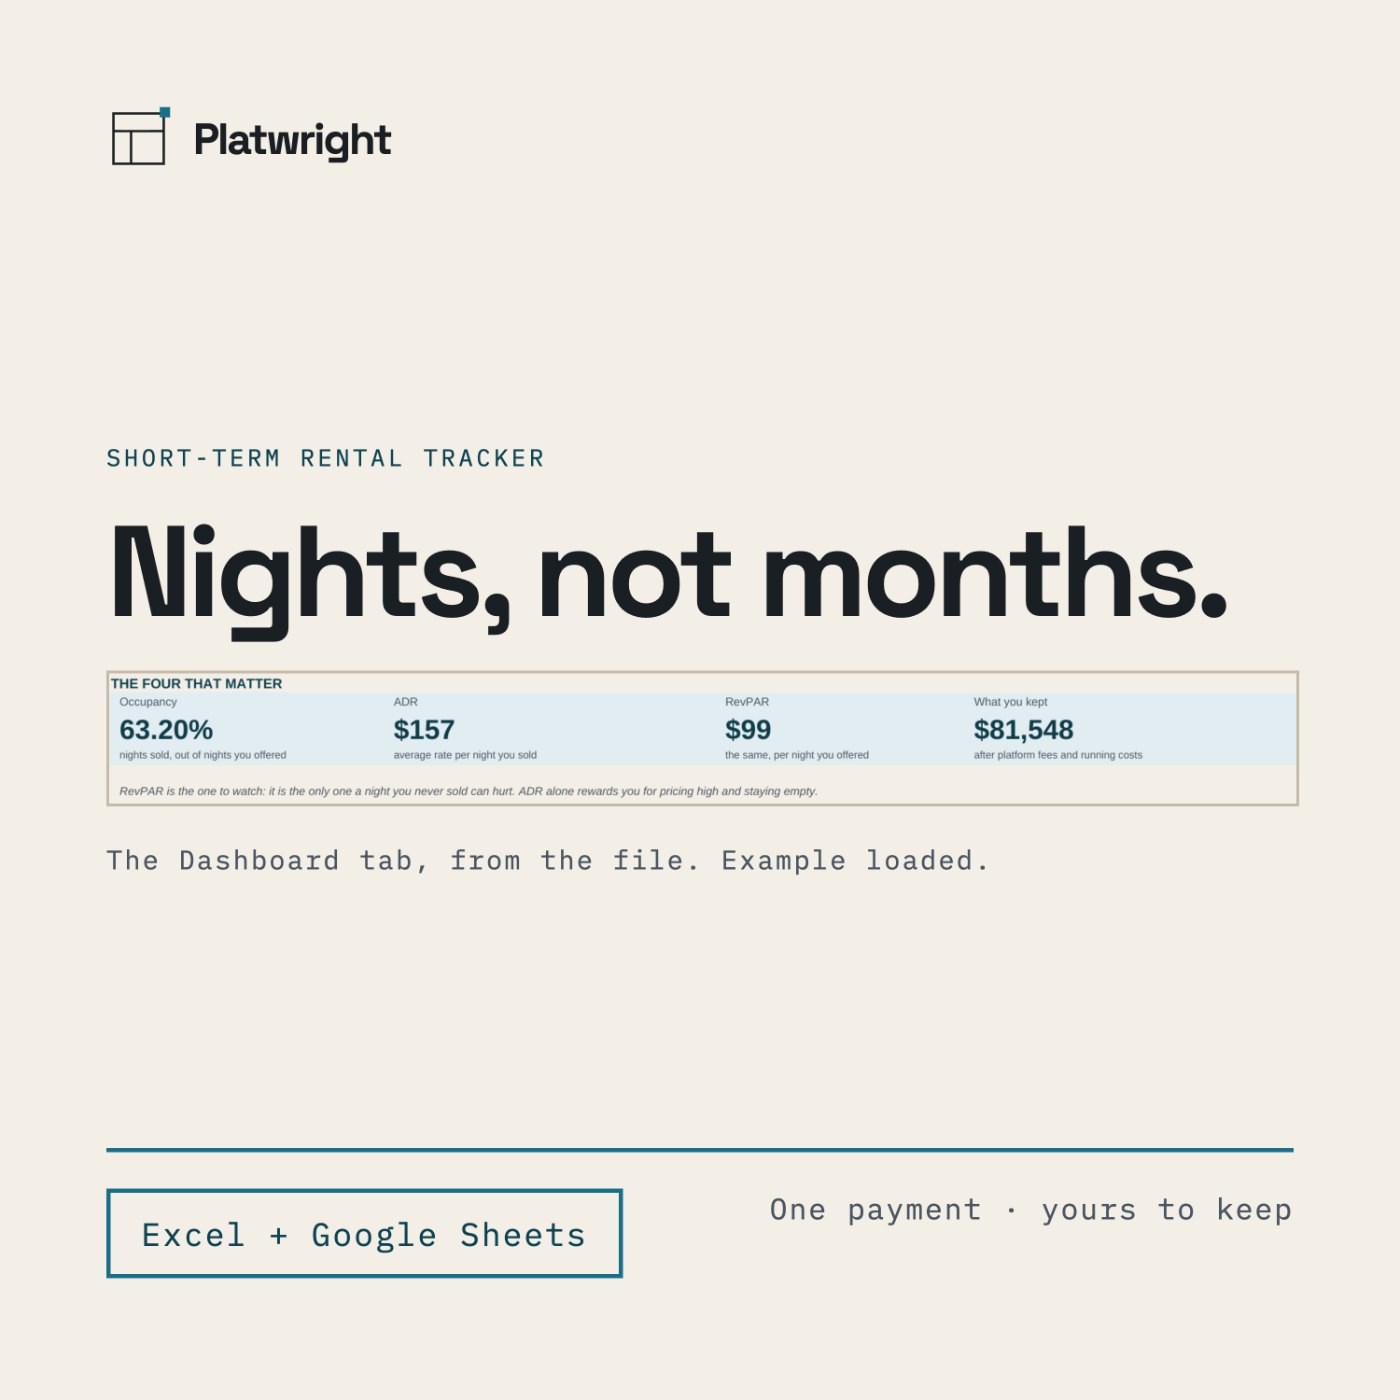
Short-Term Rental Tracker measures the year in nights. You copy six numbers per unit per month off your own platform report, and the file works out occupancy, ADR, RevPAR and what you kept — for the year, for each of the twelve months and for each of up to three units. It also puts your short-term result next to what the same units would have kept on a long lease, using the rents and the costs you typed in yourself.
The number
What's included
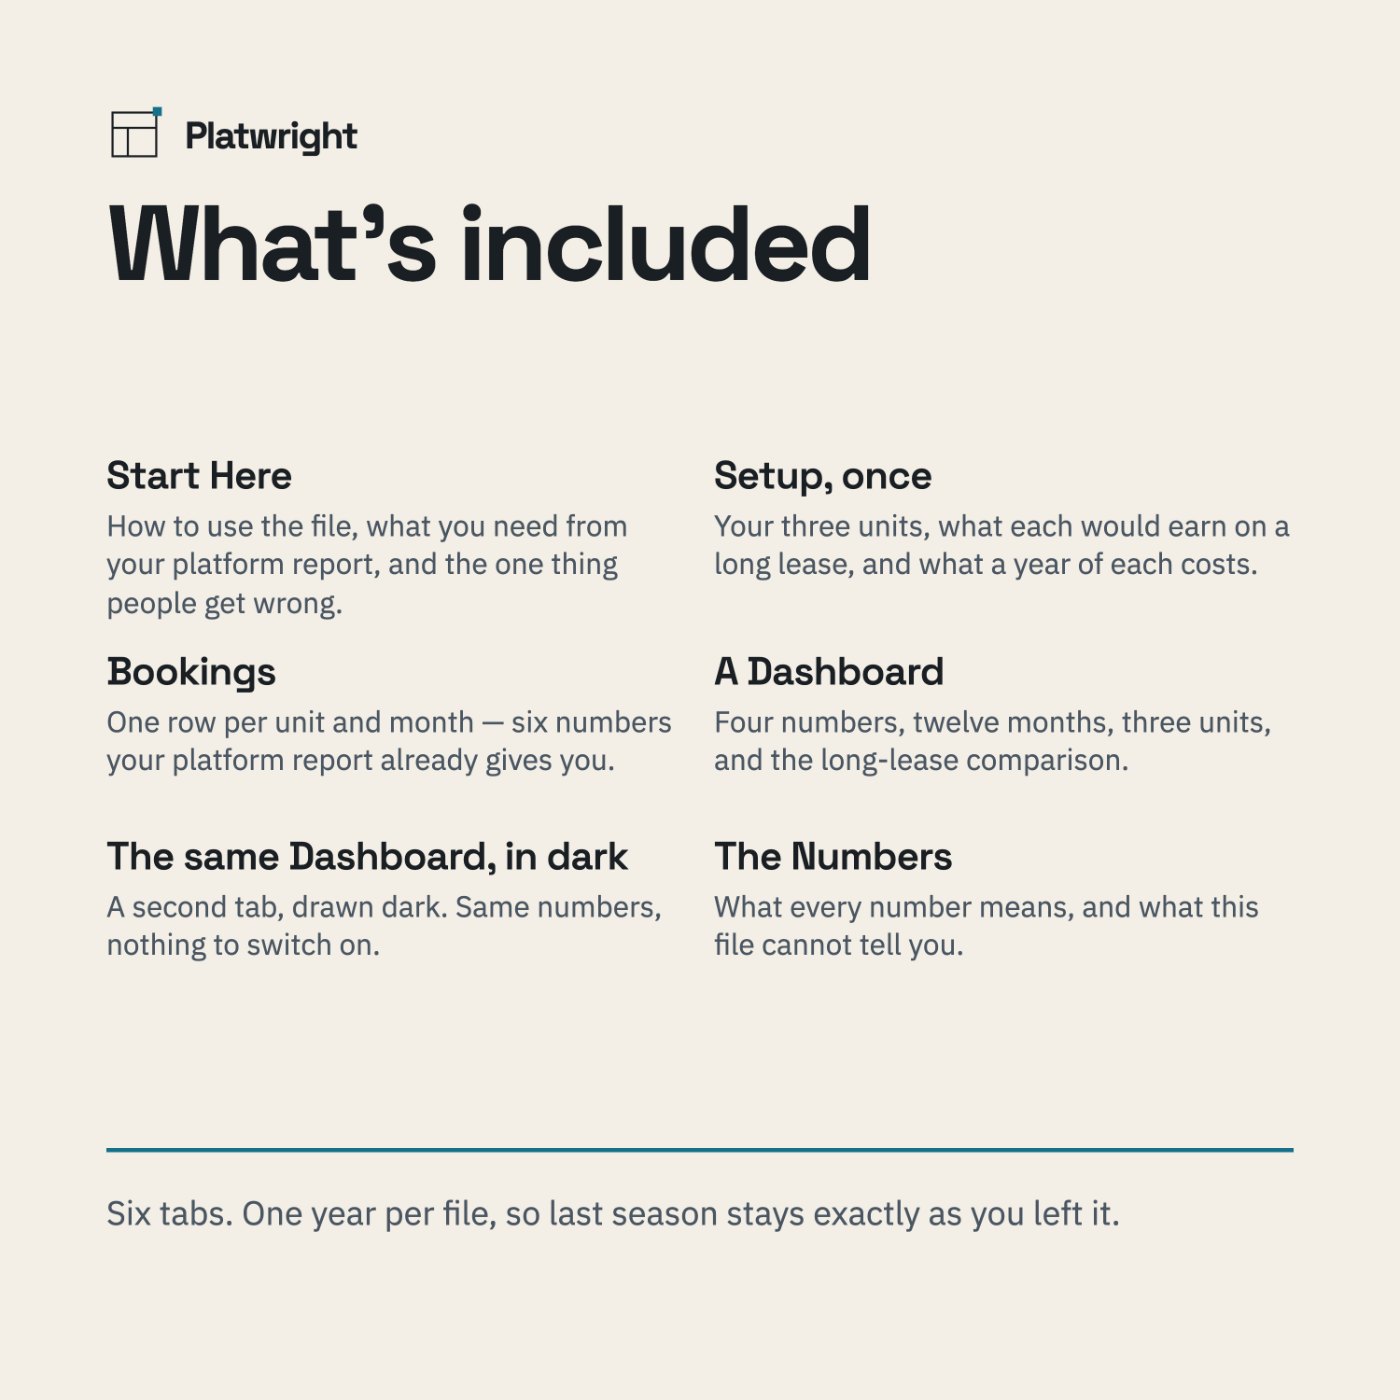
- Six tabs: Start Here · Setup · Bookings · Dashboard · Dashboard Dark · The Numbers
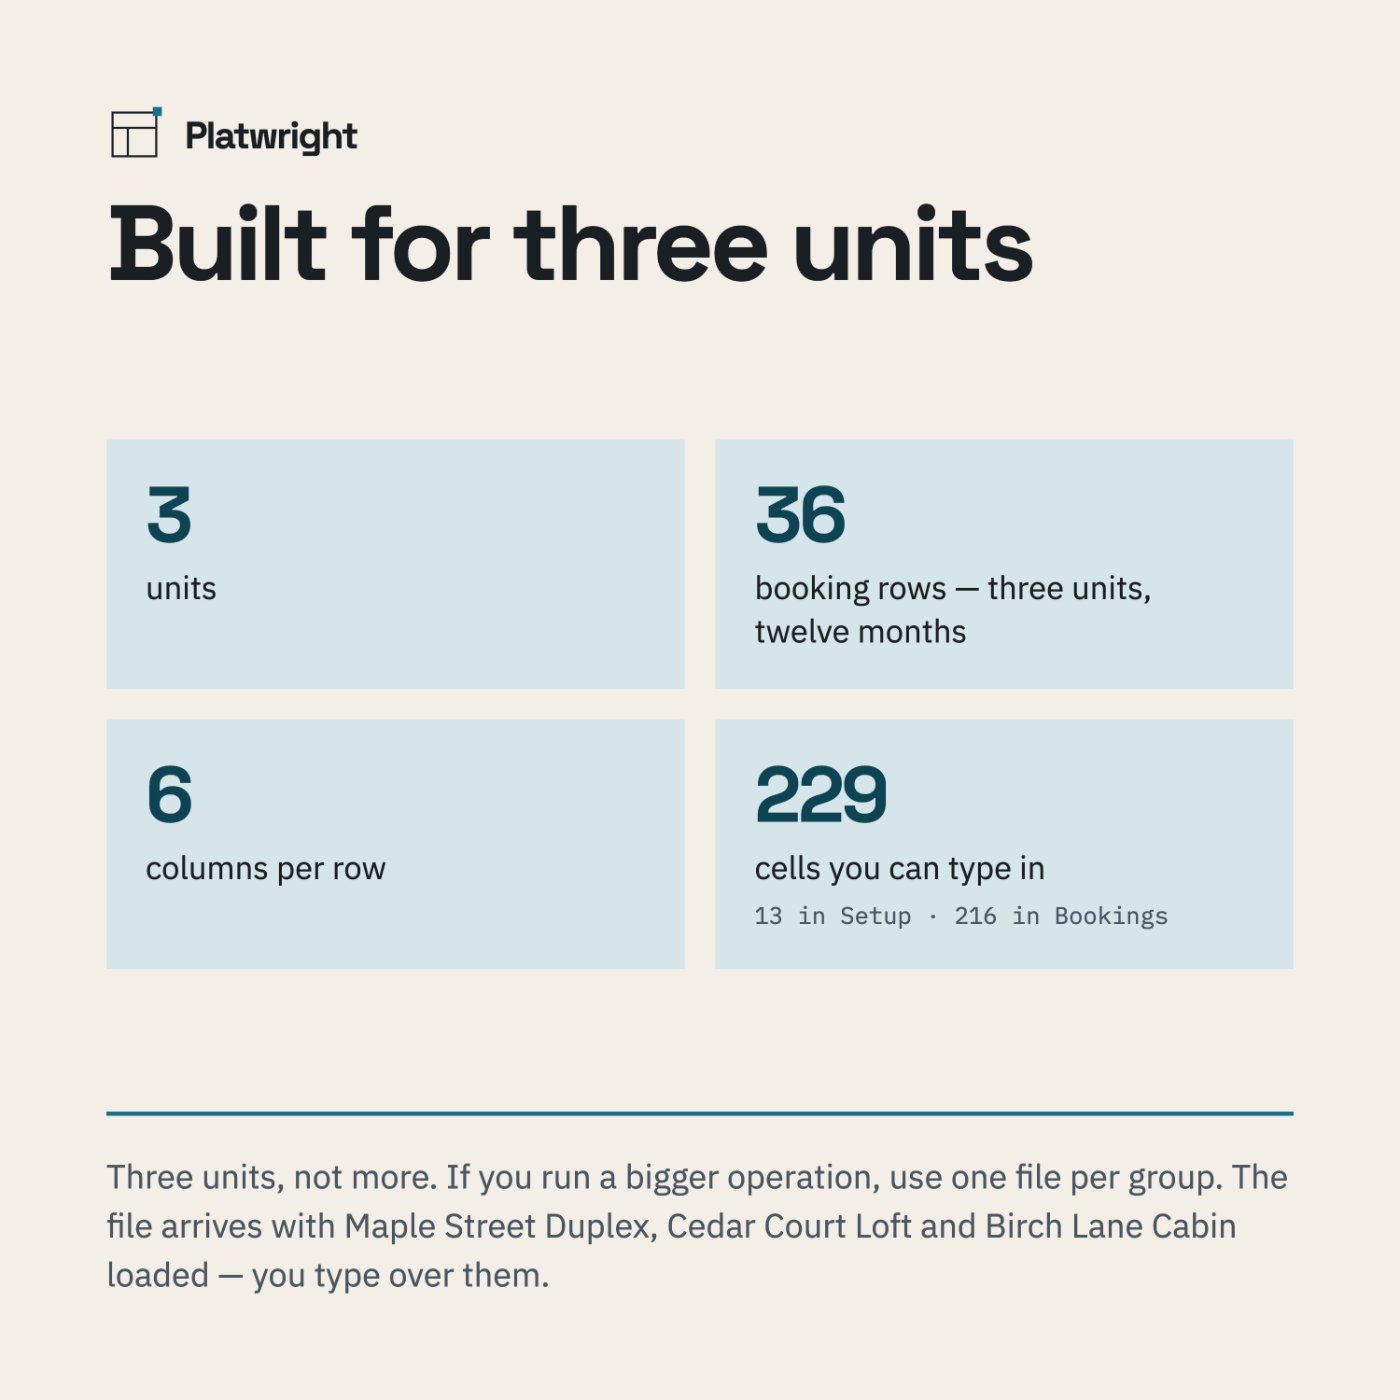
- Up to 3 units, named once in Setup
- 36 booking rows — three units × twelve months, six columns each
- 229 cells you can type in — 13 in Setup, 216 in Bookings
- A worked example already loaded — Maple Street Duplex, Cedar Court Loft and Birch Lane Cabin, with a 14.00% platform commission — so nothing is ever blank
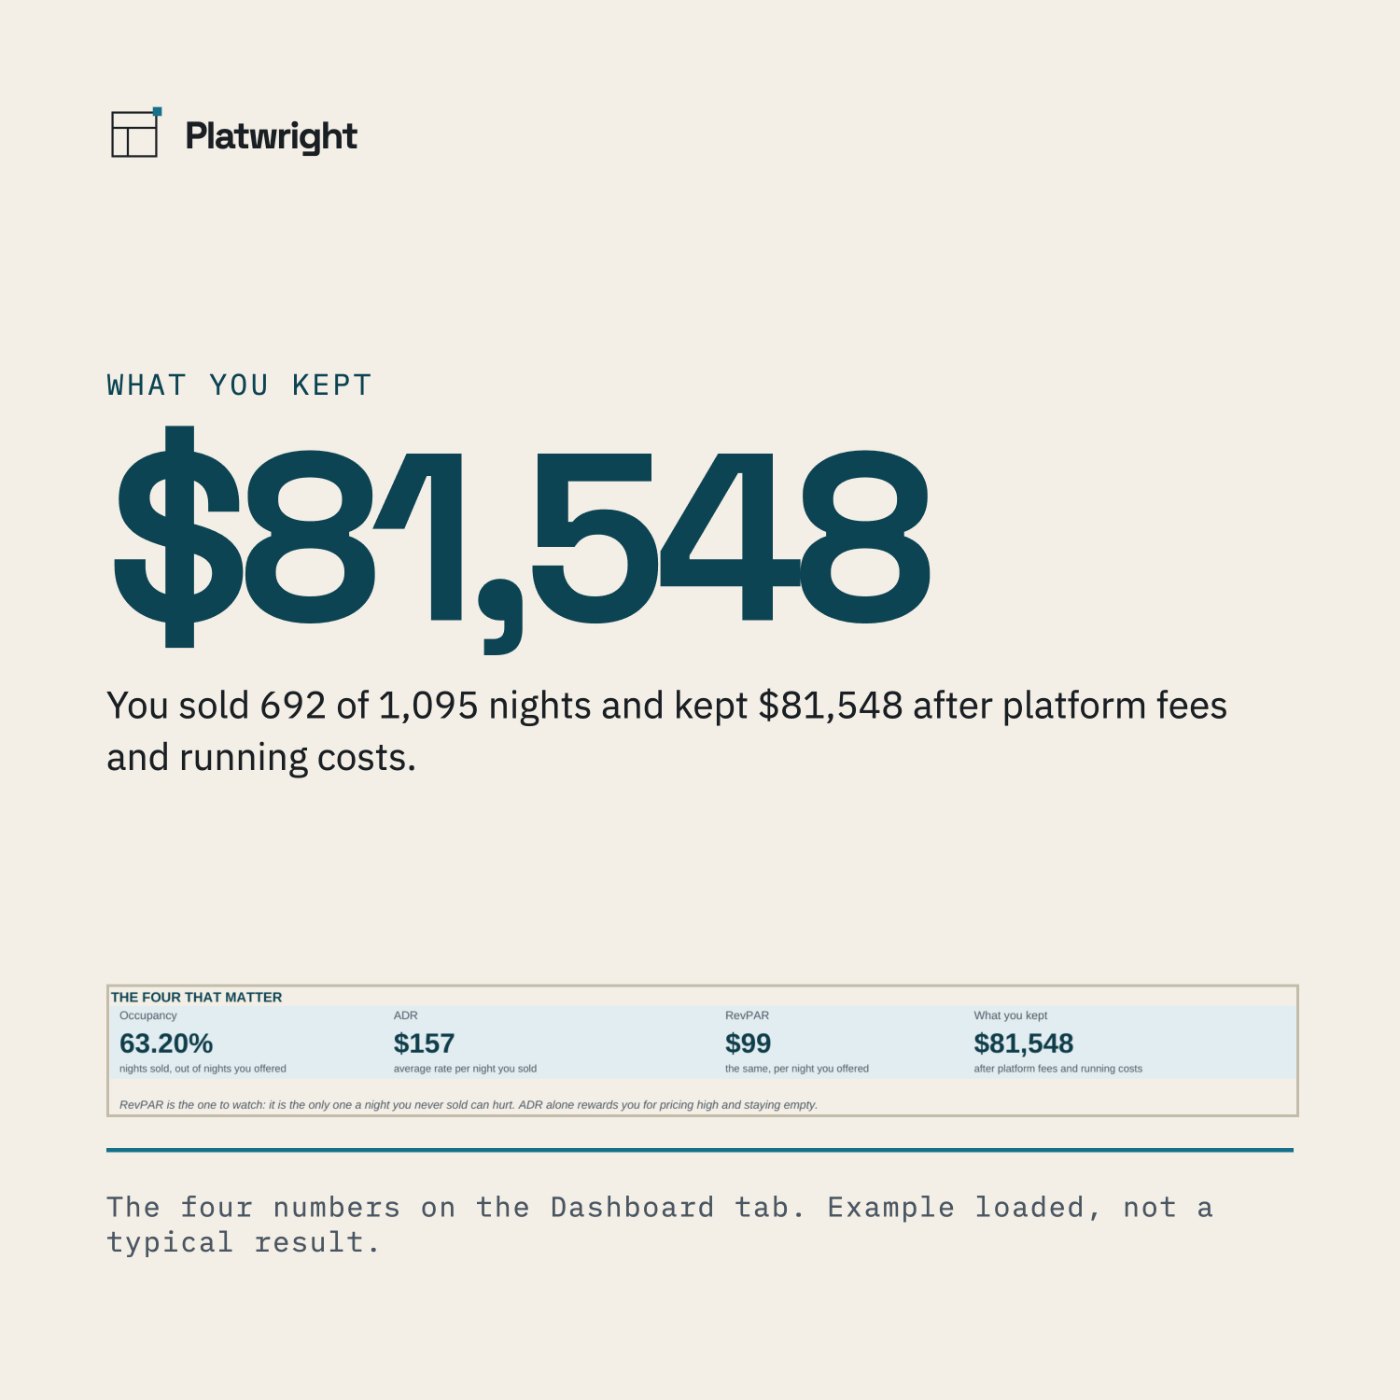
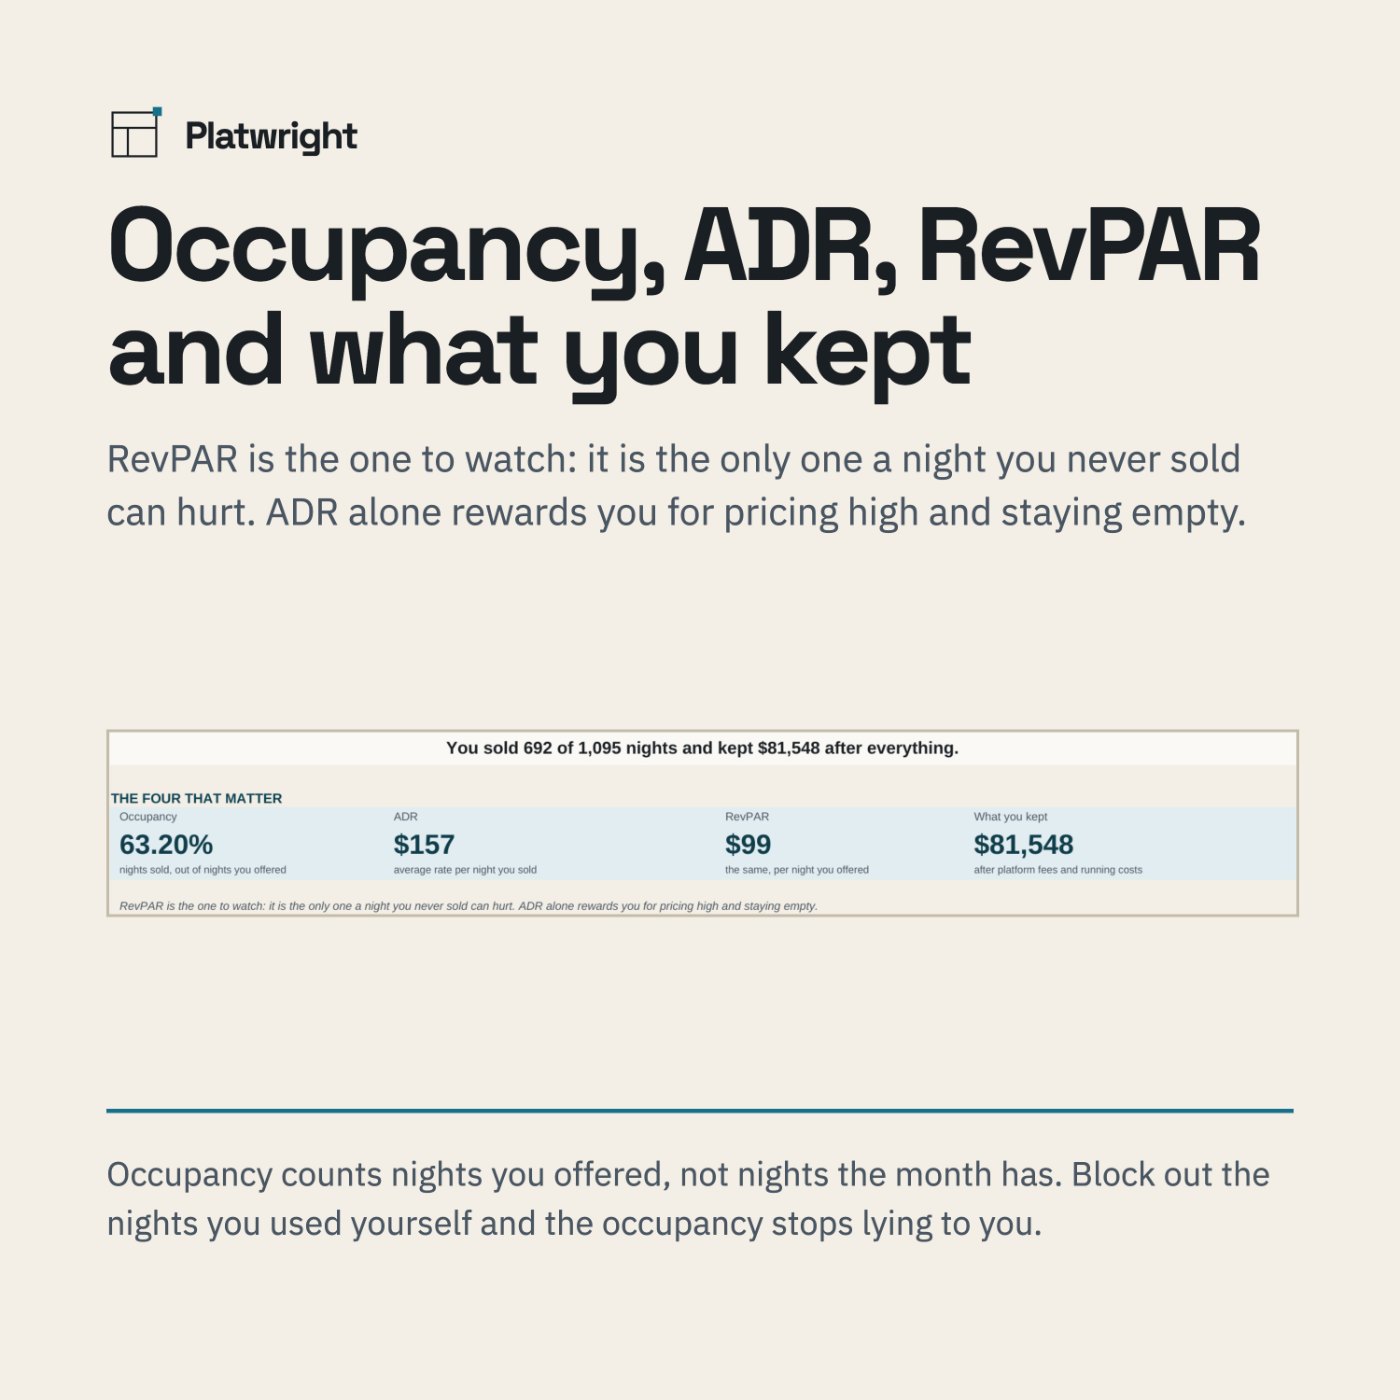
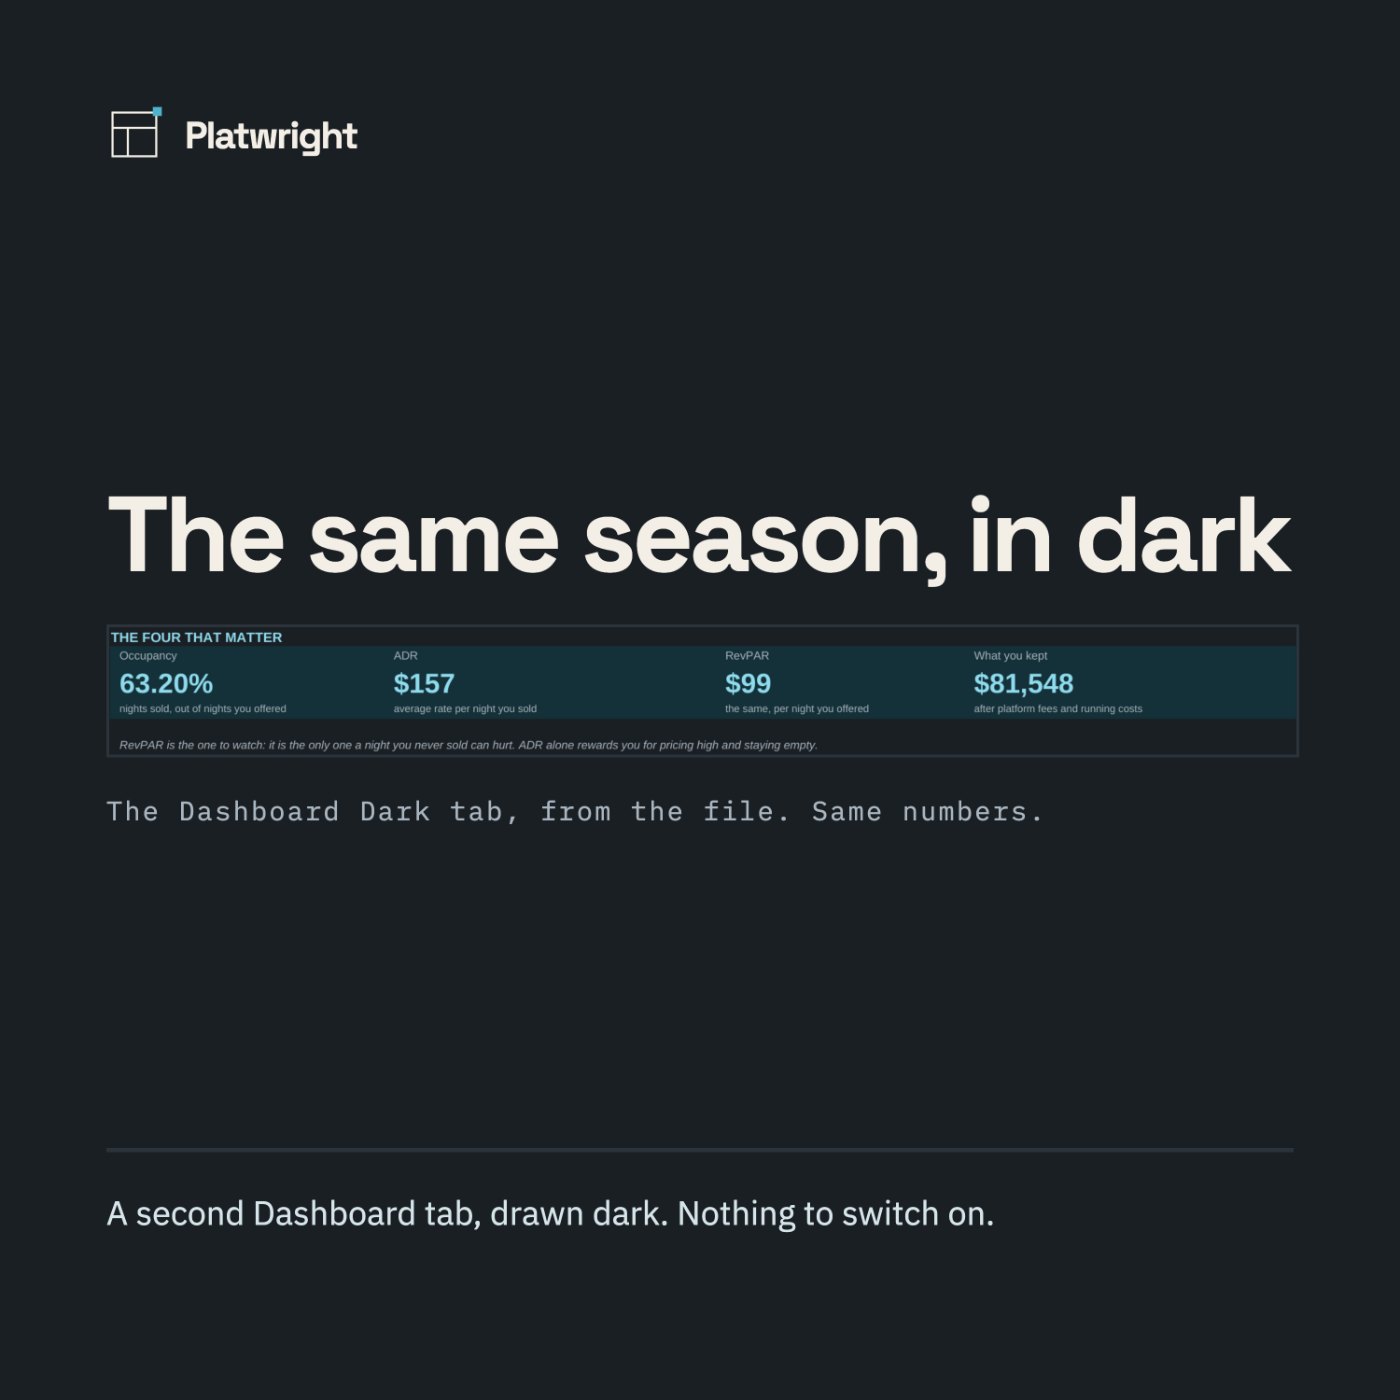
- Four headline numbers: occupancy · ADR · RevPAR · what you kept
- Ten supporting numbers behind them: accommodation revenue, cleaning fees collected, other income, everything you charged, platform fees, the platform’s share of everything you charged, what was left after platform fees, running costs, nights available and nights booked
- The long-lease comparison — what short-term kept, what a long lease at the rents you entered would have kept, and the difference, each side carrying its own costs
- Month by month, the twelve months with nights, occupancy, ADR, RevPAR and what you kept
- By unit, the same figures for each unit
- A dark Dashboard, the same view drawn on a dark background — a second tab, nothing to switch on
- The Numbers, a tab that defines every figure — including why RevPAR is the one to watch and why nights available is not the same as nights in the month — and says what the file cannot tell you
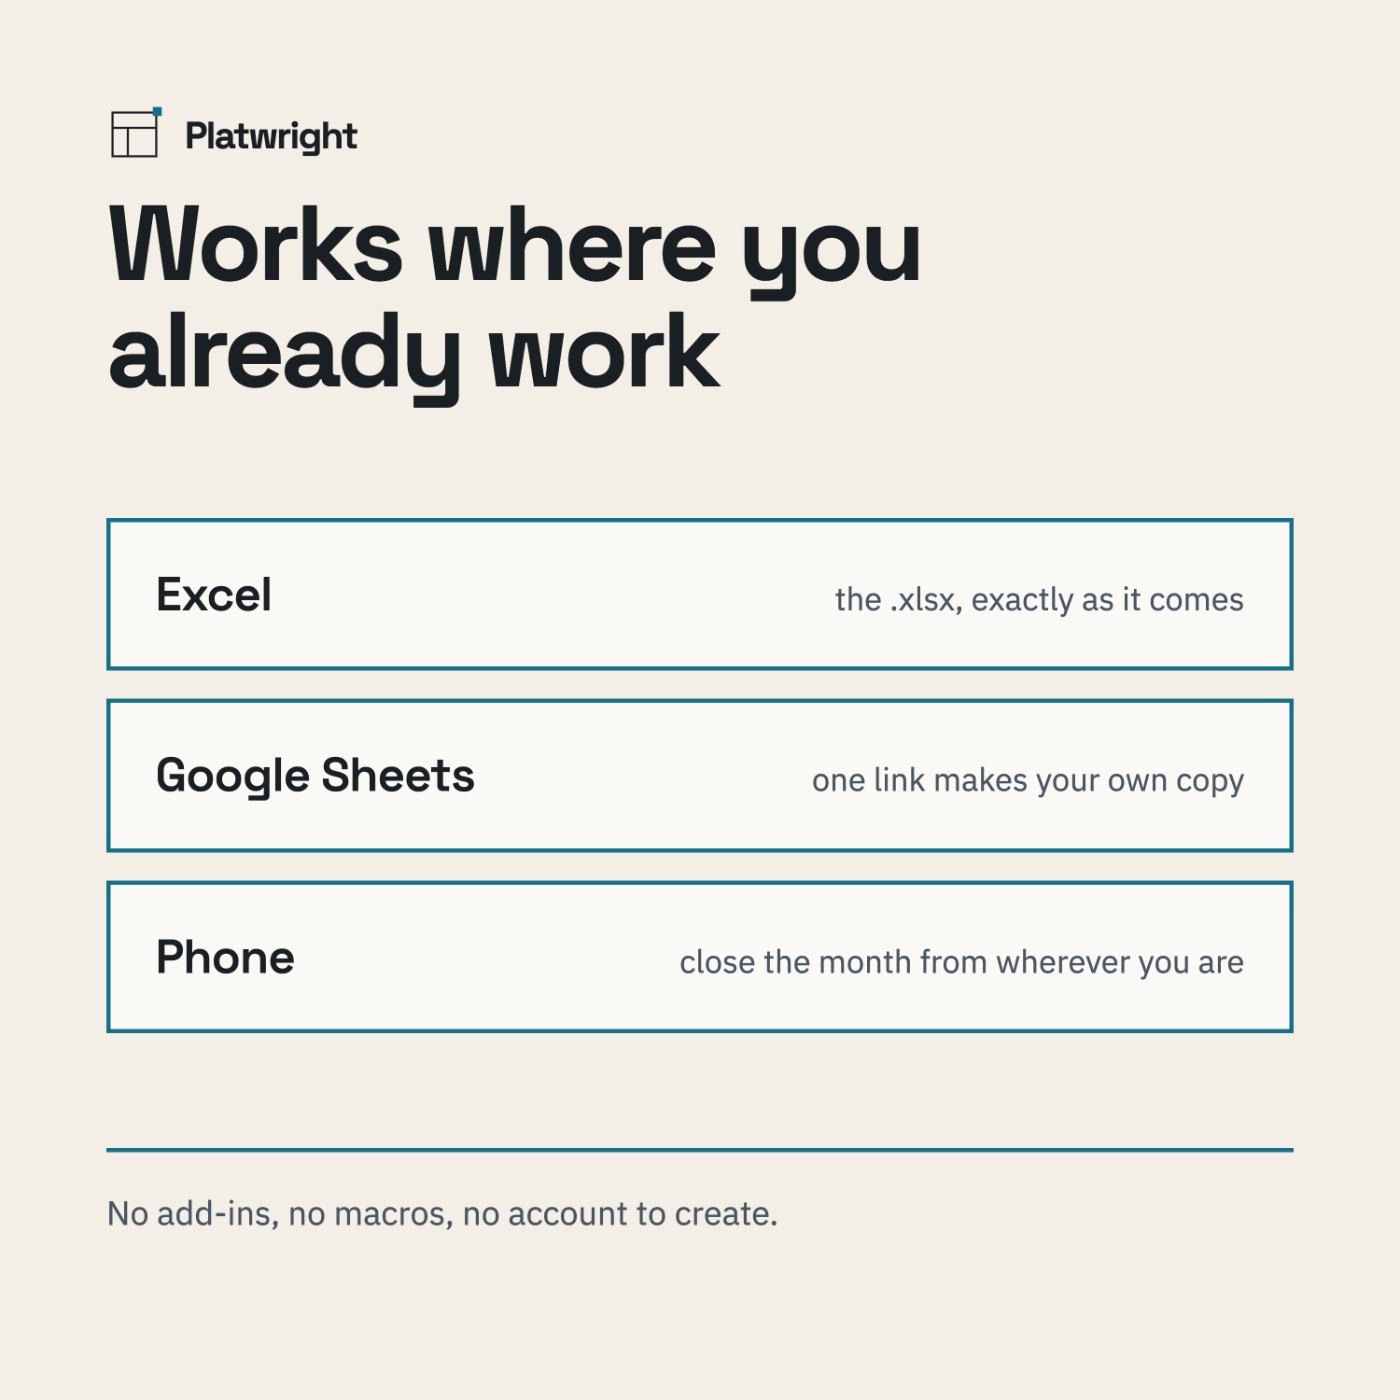
- Works in Excel and Google Sheets, desktop and mobile
- One payment. Yours to keep. No subscription
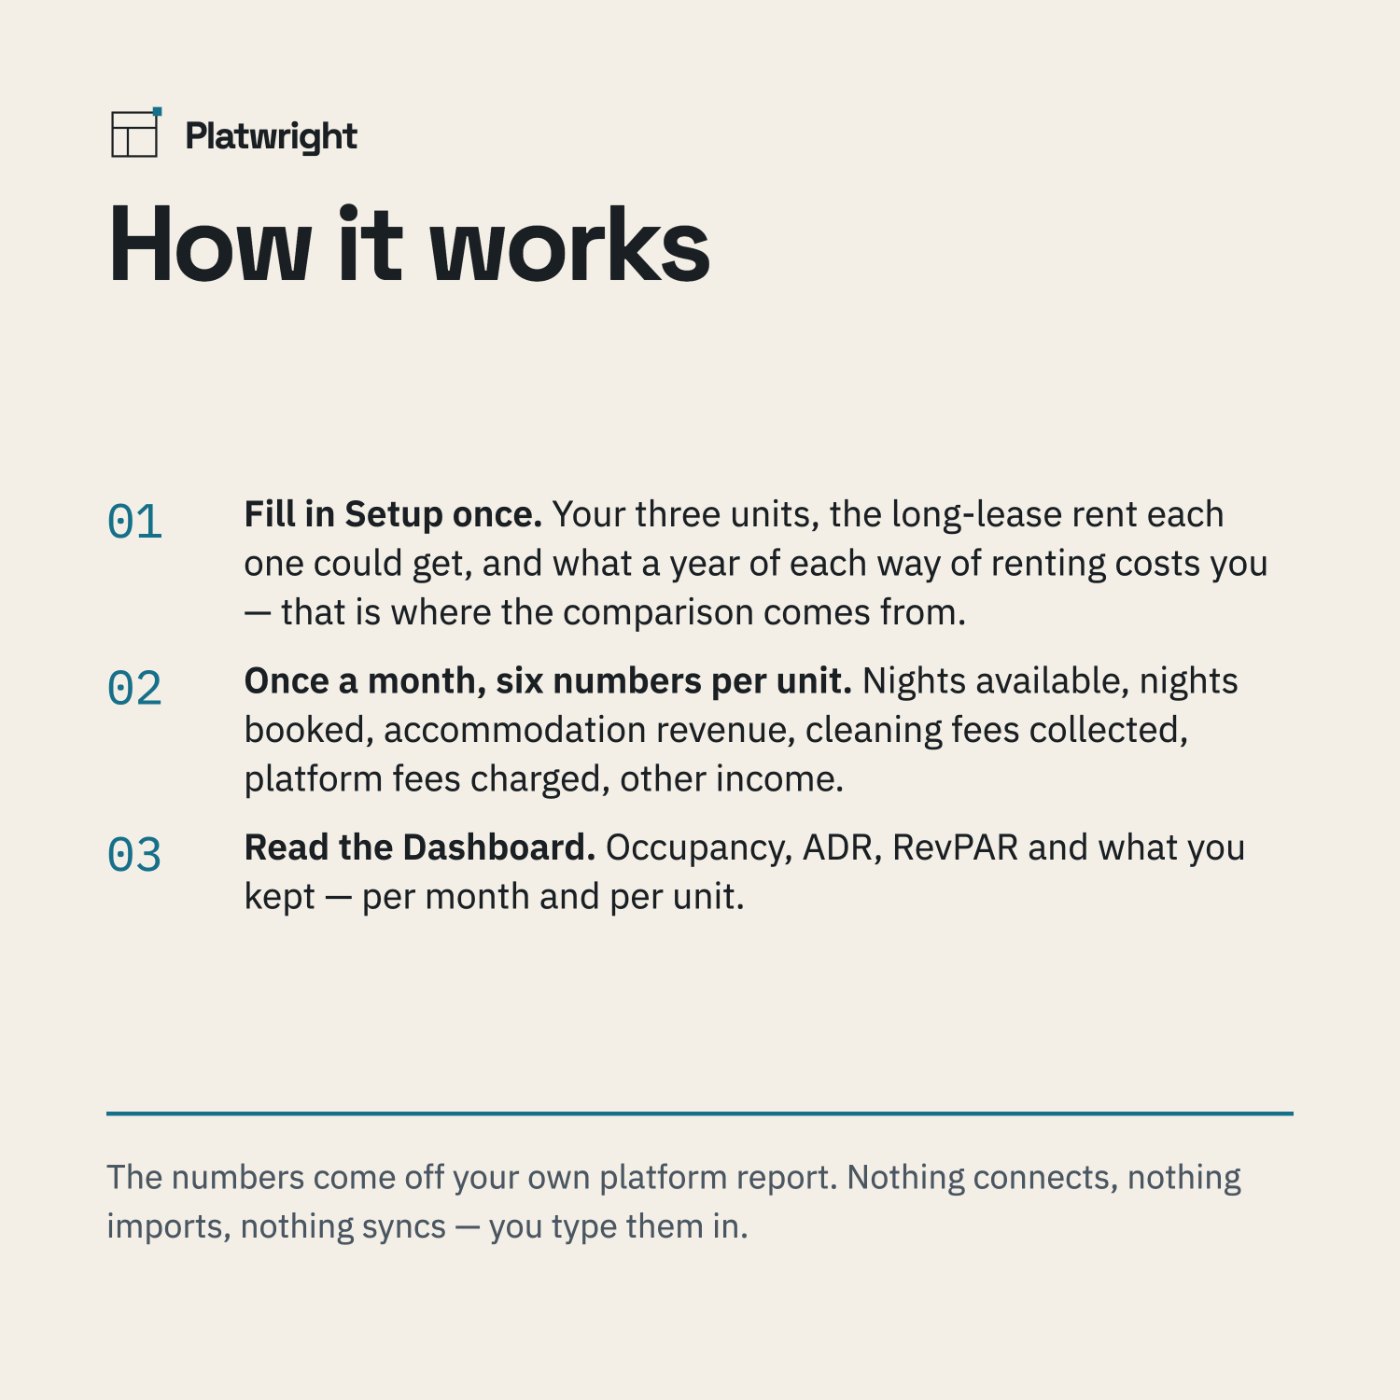
How it works
Fill in Setup once
Your three units, the long-lease rent each one could get, and what a year of each way of renting costs you — that is where the comparison comes from.
Once a month, six numbers per unit
Nights available, nights booked, accommodation revenue, cleaning fees collected, platform fees charged, other income.
Read the Dashboard
Occupancy, ADR, RevPAR and what you kept — per month and per unit.
What you see before you pay
Screenshots of the file below, with the worked example that comes loaded in it, alongside panels that spell out what is inside.
Compatibility
Microsoft Excel · Google Sheets · both mobile apps. No add-ins, no macros, no account to create. Formulas are open — you can see every calculation.
Questions
Do I need Excel?
No. The file opens in Google Sheets and in the Excel mobile app, and behaves the same in both.
Is this a subscription?
No. One payment, and the file is yours to keep. There is nothing to renew.
Does it connect to Airbnb?
No, and it never will. Nothing imports and nothing syncs: you copy six numbers per unit off the report your platform already gives you. That is also why it works the same whether you list on one platform or four.
Can I edit it?
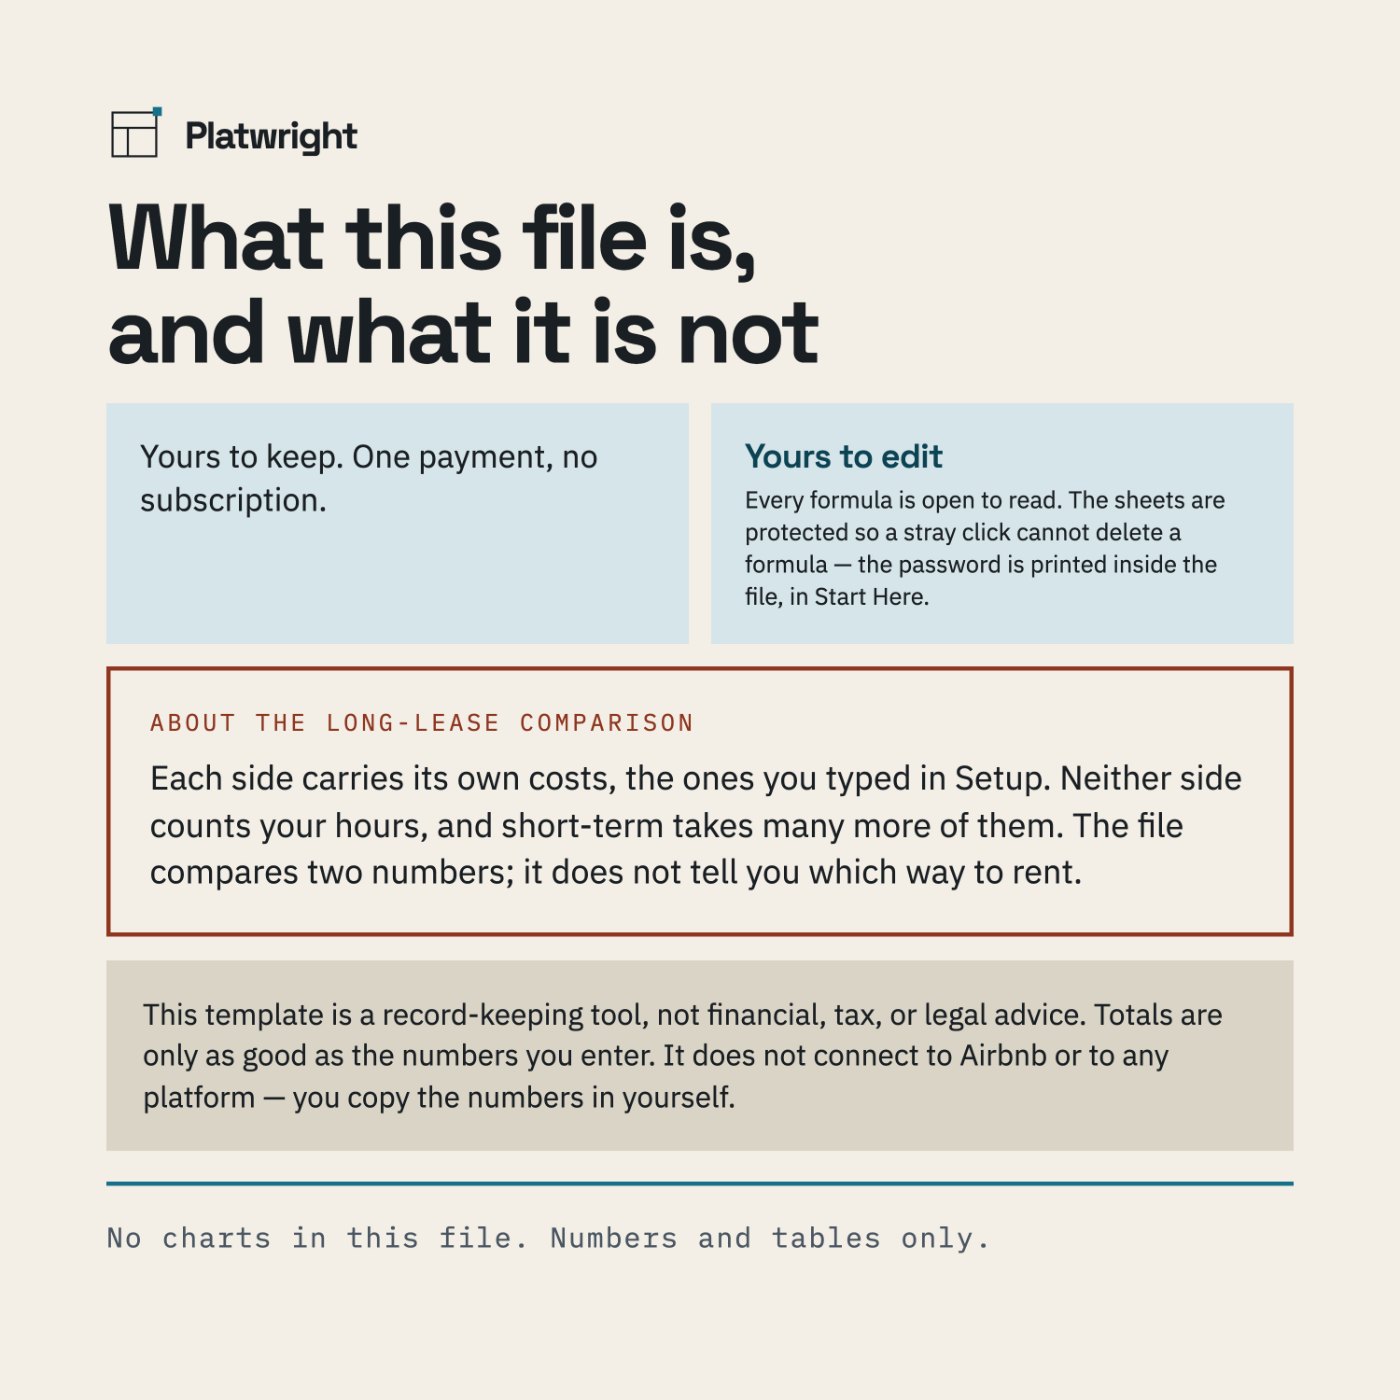
Yes. Every formula is open to read. The sheets are protected so a stray click cannot delete a formula. In Excel: Review > Unprotect Sheet. The password is printed inside the file, in Start Here. In Google Sheets: you own your copy, so you can edit anything — Sheets will just ask you to confirm first.
Does it handle more than three units?
No — three units, 36 rows. If you run more, use one file per group of three.
Does it tell me whether short-term beats a long lease?
No. It shows both figures side by side, each carrying the costs you typed in Setup. Neither side counts your hours, and short-term takes many more of them, so the comparison is a measurement and not a recommendation.
Can I use this for my taxes?
No. It is a record of your season, not a tax return, and it calculates no tax and fills no form. See the disclaimer below, and take your numbers to a qualified professional.
The worked example, in full
Every figure this file produces is written out on a page of its own — the numbers you type, the arithmetic in between, and what comes out the other side. Nothing is rounded to make a point.
- A short-term rental year, measured in nights — occupancy, ADR, RevPAR, and what was kept.
The season, measured in nights
One payment of $39, and the file is yours to keep. No subscription, nothing to renew — and a one-page Welcome Guide arrives with it.
Checkout is handled by Payhip, our payment processor, so you will leave platwright.com to pay. The file and the Welcome Guide arrive by email the moment the payment clears. If anything goes wrong with the download, email platwrightdr@gmail.com and I will sort it.
This template is a record-keeping tool, not financial, tax, or legal advice. Totals are only as good as the numbers you enter. It does not connect to Airbnb or to any platform — you copy the numbers in yourself.